Why Your Database Queries Are Slow and How to Fix Them
Introduction
Database performance is one of the most critical factors that determine the success of modern software systems.
You can build a beautiful user interface, deploy highly scalable microservices, and use the latest cloud infrastructure, but if your database queries are slow, your application will eventually suffer.
Every web application, mobile app, SaaS platform, e-commerce system, ERP solution, or enterprise platform depends heavily on database performance. The database is often the final destination for retrieving and storing data, making it one of the most important components in your architecture.
When queries become slow, the effects ripple across the entire system:
- Pages take longer to load
- APIs become sluggish
- Infrastructure costs increase
- User satisfaction decreases
- Conversion rates drop
- Revenue suffers
A delay of even a few hundred milliseconds can significantly impact user engagement.
Consider an online store where product pages take 8 seconds to load. Customers abandon their carts. Sales decline. Support tickets increase. Engineering teams scramble to identify bottlenecks.
In many cases, the root cause isn’t insufficient hardware.
It’s inefficient database queries.
Common causes include:
- Missing indexes
- Poor query design
- Full table scans
- N+1 query issues
- Excessive joins
- Inefficient pagination
- Unoptimized ORM usage
- Lack of caching
- Poor schema design
Understanding why queries become slow is the first step toward building scalable systems.
Understanding How Database Query Execution Works
Before optimizing queries, it’s important to understand what actually happens when a query reaches the database.
Many developers write SQL but never investigate how databases process it internally.
That missing knowledge often leads to poor performance decisions.
The Journey of a Query
Consider the following query:
SELECT *
FROM users
WHERE email = 'john@example.com';
Although this appears simple, several complex steps occur behind the scenes.
Step 1: Query Parsing
The database first parses the SQL statement.
It checks:
- Syntax validity
- Table existence
- Column existence
- User permissions
For example:
SELECT *
FROM users
WHERE email = 'john@example.com';
The parser converts this into an internal representation known as a query tree.
Step 2: Query Optimization
The optimizer determines the most efficient way to execute the query.
It asks questions such as:
- Should I use an index?
- Should I scan the entire table?
- How many rows are expected?
- Which join strategy is cheapest?
The optimizer’s goal is minimizing resource usage.
Step 3: Cost Estimation
Databases estimate execution cost before running queries.
Factors include:
- Number of rows
- Disk reads
- Memory consumption
- CPU operations
- Join complexity
The optimizer selects the lowest-cost execution path.
Step 4: Query Execution
The execution engine performs the actual work.
This may involve:
- Reading index pages
- Reading table pages
- Performing joins
- Sorting results
- Aggregating data
Disk I/O vs Memory Access
One of the biggest performance factors is where data resides.
| Access Type | Approximate Speed |
|---|---|
| CPU Cache | Nanoseconds |
| RAM | Microseconds |
| SSD | Hundreds of Microseconds |
| HDD | Milliseconds |
Reading data from memory is dramatically faster than reading from disk.
This is why databases aggressively cache frequently accessed data.
Full Table Scans
Imagine a users table containing 10 million rows.
SELECT *
FROM users
WHERE email = 'john@example.com';
Without an index, the database may inspect every row.
This is known as a Full Table Scan.
Process:
- Read row 1
- Check email
- Read row 2
- Check email
- Continue until row 10 million
The larger the table becomes, the slower the query becomes.
Query Execution Plans
Execution plans show exactly how the database intends to execute a query.
Example:
EXPLAIN
SELECT *
FROM users
WHERE email = 'john@example.com';
Possible output:
Index Scan using idx_users_email on users
(cost=0.43..8.45 rows=1 width=128)
The execution plan reveals:
- Access method
- Estimated rows
- Cost estimates
- Resource usage
Sequential Scan
Seq Scan on users
The database reads every row.
Usually slow on large tables.
Index Scan
Index Scan using idx_users_email
The database uses an index.
Typically much faster.
Nested Loop Join
Nested Loop
Common when joining small datasets.
Algorithm:
For each row in table A
    Search matching rows in table B
Efficient for small result sets.
Hash Join
Hash Join
Creates a hash table in memory.
Excellent for large joins.
Merge Join
Merge Join
Works best when datasets are already sorted.
Highly efficient for large sorted data.

Indexes Explained with Practical Examples
Indexes are among the most powerful tools available for improving database performance.
Yet many developers either ignore them or misuse them.
What Is an Index?
An index is a specialized data structure that helps databases locate data quickly.
Think of a phone book.
Without an index:
You would read every page until finding a name.
With an index:
You jump directly to the correct section.
Databases work the same way.
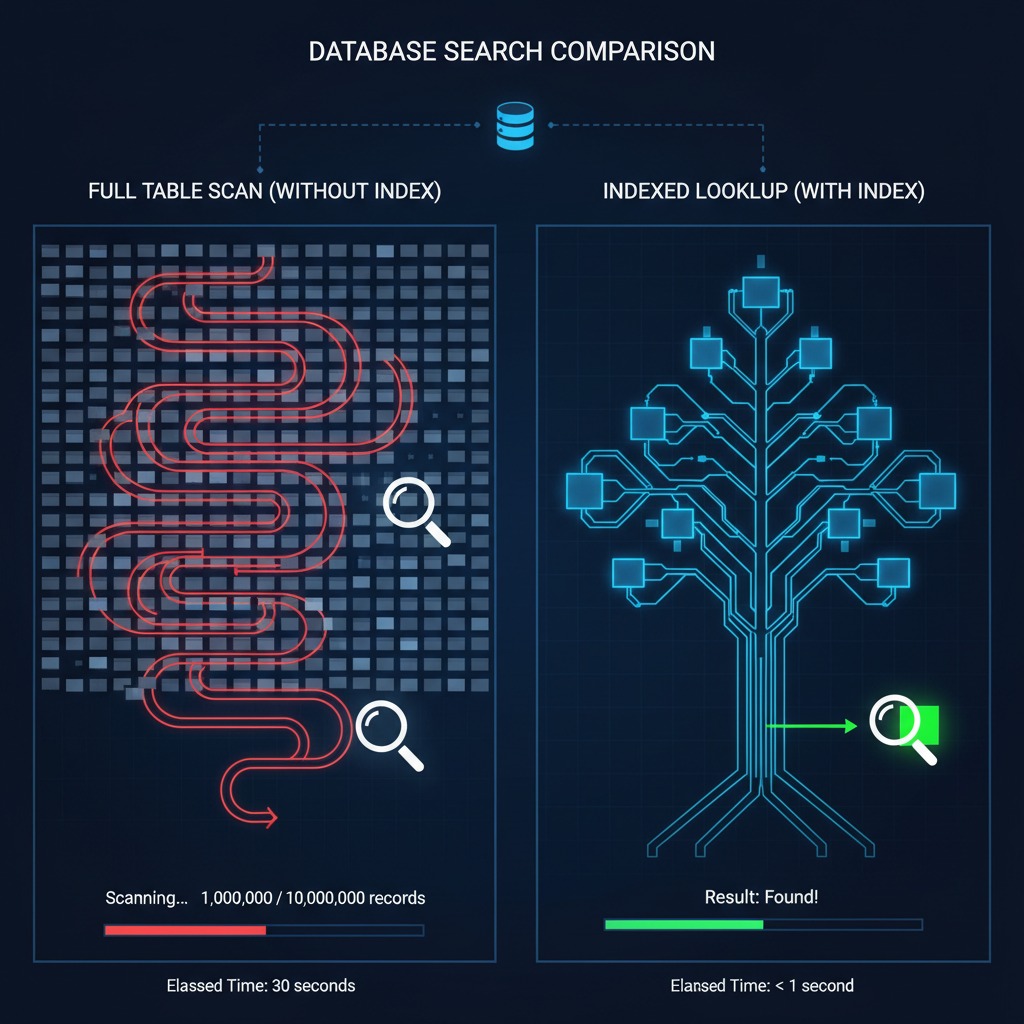
Example Without an Index
SELECT *
FROM users
WHERE email = 'john@example.com';
Table size:
1,000,000 rows
Potential execution:
Sequential Scan
Execution time:
4.2 seconds
Adding an Index
CREATE INDEX idx_users_email
ON users(email);
Now the database can navigate directly to matching rows.
Execution time:
12 milliseconds
Performance Comparison
| Query Type | Rows | Execution Time |
|---|---|---|
| No Index | 1,000,000 | 4.2 sec |
| Indexed | 1,000,000 | 12 ms |
The difference is dramatic.
How B-Tree Indexes Work
Most relational databases use B-Trees.
A B-Tree maintains sorted values.
Example:
A
 ├── D
 ├── H
 └── Z
Searching becomes logarithmic rather than linear.
Complexity:
Full Scan: O(n)
Index Search: O(log n)
Hash Indexes
Hash indexes use hash functions.
Ideal for:
WHERE email = ?
Less effective for:
WHERE email LIKE 'john%'
Composite Indexes
Example:
CREATE INDEX idx_user_name_country
ON users(last_name, country);
Useful for:
WHERE last_name = 'Smith'
AND country = 'USA'
Order matters.
Good:
(last_name, country)
Bad:
(country, last_name)
if queries primarily filter by last_name.
Unique Indexes
CREATE UNIQUE INDEX idx_email
ON users(email);
Benefits:
- Faster lookups
- Enforced uniqueness
- Better data integrity
Covering Indexes
A covering index contains all required columns.
Example:
SELECT first_name, last_name
FROM users
WHERE email = 'john@example.com';
Index:
CREATE INDEX idx_cover
ON users(email, first_name, last_name);
Database may avoid reading the table entirely.
This can significantly improve performance.
When Indexes Hurt Performance
Indexes are not free.
Every insert, update, and delete must maintain them.
Excessive Indexes
Bad example:
20 indexes on one table
Consequences:
- Slower writes
- More storage
- Longer backups
Slower INSERTs
Each insert updates every index.
More indexes = more work.
Slower UPDATEs
Changing indexed values requires index maintenance.
Increased Storage
Indexes consume disk space.
Large systems often store hundreds of gigabytes of indexes.
The N+1 Query Problem
The N+1 problem is one of the most common performance issues in modern applications.
It’s especially common when using ORMs.
What Is N+1?
Suppose we fetch all users:
$users = User::all();
Then:
foreach ($users as $user) {
    echo $user->posts;
}
Looks innocent.
But behind the scenes:
SELECT * FROM users;
Then:
SELECT * FROM posts WHERE user_id = 1;
SELECT * FROM posts WHERE user_id = 2;
SELECT * FROM posts WHERE user_id = 3;
And so on.
If there are 100 users:
1 + 100 = 101 queries
Hence:
N+1
Why Developers Miss It
ORMs abstract SQL.
Developers often don’t realize how many queries are executed.
Everything works fine in development.
Production traffic exposes the problem.
The Solution: Eager Loading
Laravel example:
$users = User::with('posts')->get();
Generated queries:
SELECT * FROM users;

SELECT * FROM posts
WHERE user_id IN (...);
Only two queries.
Comparison
| Approach | Queries |
|---|---|
| N+1 | 101 |
| Eager Loading | 2 |
Impact at Scale
Imagine:
- 10,000 users
- 50 requests per second
N+1 can generate hundreds of thousands of unnecessary database operations.
CPU usage skyrockets.
Response times increase dramatically.
Lorem Ipsum has been the industry’s standard dummy text ever since the 1500s.
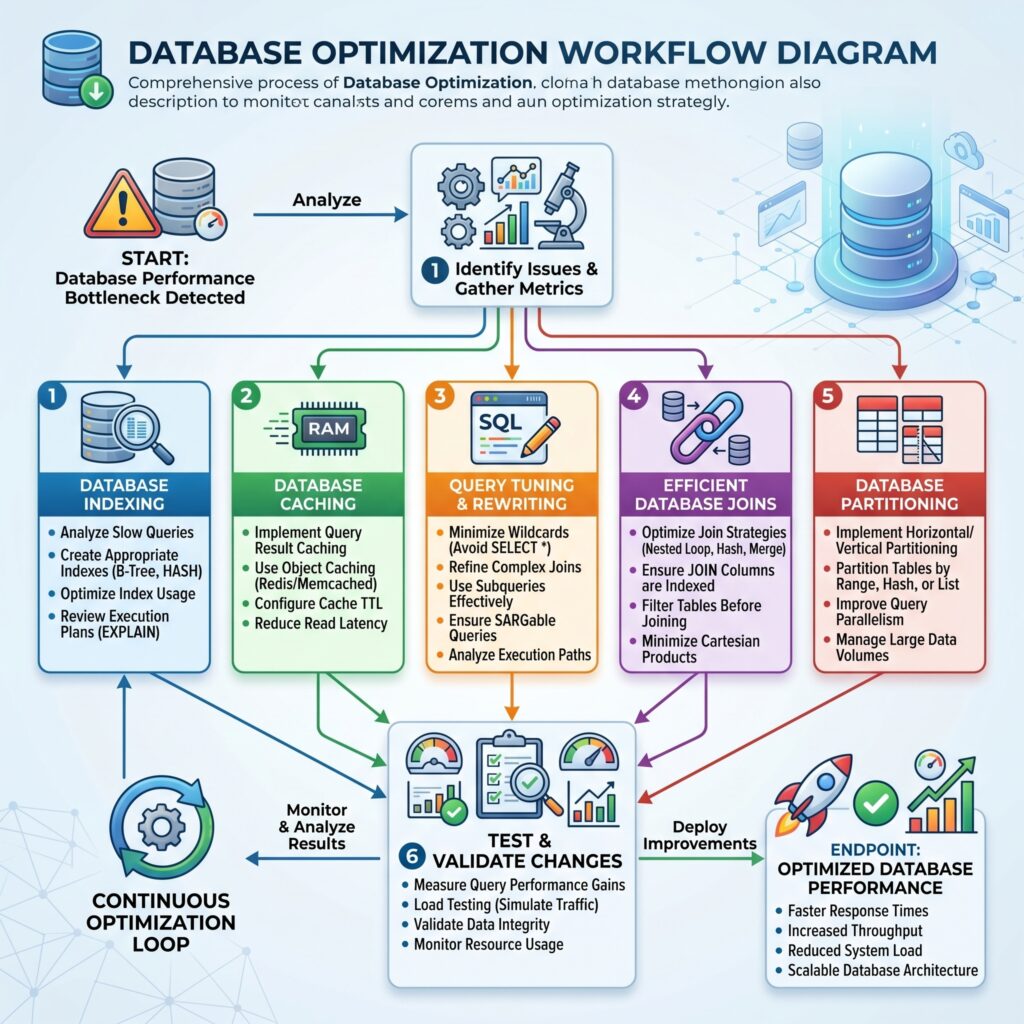
Query Optimization Techniques
Optimization involves reducing unnecessary work.
Let’s explore the highest-impact techniques.
Select Only Required Columns
Bad:
SELECT *
FROM users;
Good:
SELECT id, name
FROM users;
Benefits:
- Less network traffic
- Less memory usage
- Faster execution
Avoid Unnecessary Joins
Bad:
SELECT *
FROM users
JOIN orders
ON users.id = orders.user_id
JOIN addresses
ON users.id = addresses.user_id;
Only join tables you actually need.
Use Proper WHERE Clauses
Bad:
SELECT *
FROM orders
WHERE YEAR(order_date) = 2025;
This often prevents index usage.
Better:
SELECT *
FROM orders
WHERE order_date >= '2025-01-01'
AND order_date < '2026-01-01';
Indexes can be utilized efficiently.
Optimize Pagination
Traditional pagination:
LIMIT 20 OFFSET 100000;
Problem:
Database must skip 100,000 rows.
Better:
WHERE id > 100000
ORDER BY id
LIMIT 20;
Known as keyset pagination.
Benefits:
- Faster
- More scalable
Use Database Caching
Popular options:
Redis
Stores frequently requested data in memory.
Example:
Product Catalog
User Sessions
Search Results
Query Cache
Some database engines cache results automatically.
Application Cache
Store expensive calculations outside the database.
Optimize Joins
Inner Join
Returns matching rows.
SELECT *
FROM users
INNER JOIN orders
ON users.id = orders.user_id;
Usually efficient.
Left Join
Returns all left-side rows.
Use only when necessary.
Index Foreign Keys
CREATE INDEX idx_orders_user_id
ON orders(user_id);
Huge improvement for joins.
Batch Operations
Bad:
INSERT INTO logs VALUES (...);
Repeated 1000 times.
Good:
INSERT INTO logs
VALUES
(...),
(...),
(...);
Benefits:
- Fewer round trips
- Reduced overhead
Partitioning Large Tables
Partitioning divides large tables into smaller pieces.
Range Partitioning
Orders_2023
Orders_2024
Orders_2025
Queries only scan relevant partitions.
Hash Partitioning
Data distributed evenly using hashing.
Useful for large workloads.
Benefits:
- Faster scans
- Improved maintenance
- Better scalability
Real-World Performance Case Study
Let’s examine a realistic optimization project.
Scenario
An e-commerce platform reported severe performance issues.
Metrics Before Optimization
| Metric | Value |
|---|---|
| Users | 3 Million |
| Products | 20 Million |
| Average Load Time | 8.7 sec |
| Database CPU | 92% |
Customer complaints increased significantly.
Investigation
Step 1: Slow Query Analysis
Top offender:
SELECT *
FROM products
WHERE category_id = 14
ORDER BY created_at DESC;
Execution time:
4.1 seconds
Execution plan revealed:
Sequential Scan
No index existed.
Step 2: Missing Indexes
Added:
CREATE INDEX idx_products_category_created
ON products(category_id, created_at);
Query dropped to:
65 ms
Step 3: N+1 Discovery
Product listing page executed:
321 queries
After eager loading:
5 queries
Step 4: Excessive Joins
Several reports joined:
8 tables
Most joins were unnecessary.
Queries were rewritten.
Step 5: Caching
Implemented Redis caching for:
- Product categories
- Product metadata
- Search filters
Cache hit rate exceeded:
90%
Step 6: Pagination Improvement
Replaced:
LIMIT 50 OFFSET 500000
with keyset pagination.
Large search pages became dramatically faster.
Results
| Metric | Before | After |
|---|---|---|
| Page Load | 8.7 sec | 1.2 sec |
| Query Time | 4.1 sec | 65 ms |
| CPU Usage | 92% | 37% |
| Infrastructure Cost | $8,000/mo | $4,500/mo |
Lessons Learned
- Measure before optimizing.
- Indexes often provide the biggest gains.
- N+1 issues hide in ORMs.
- Caching reduces database pressure.
- Execution plans reveal the truth.
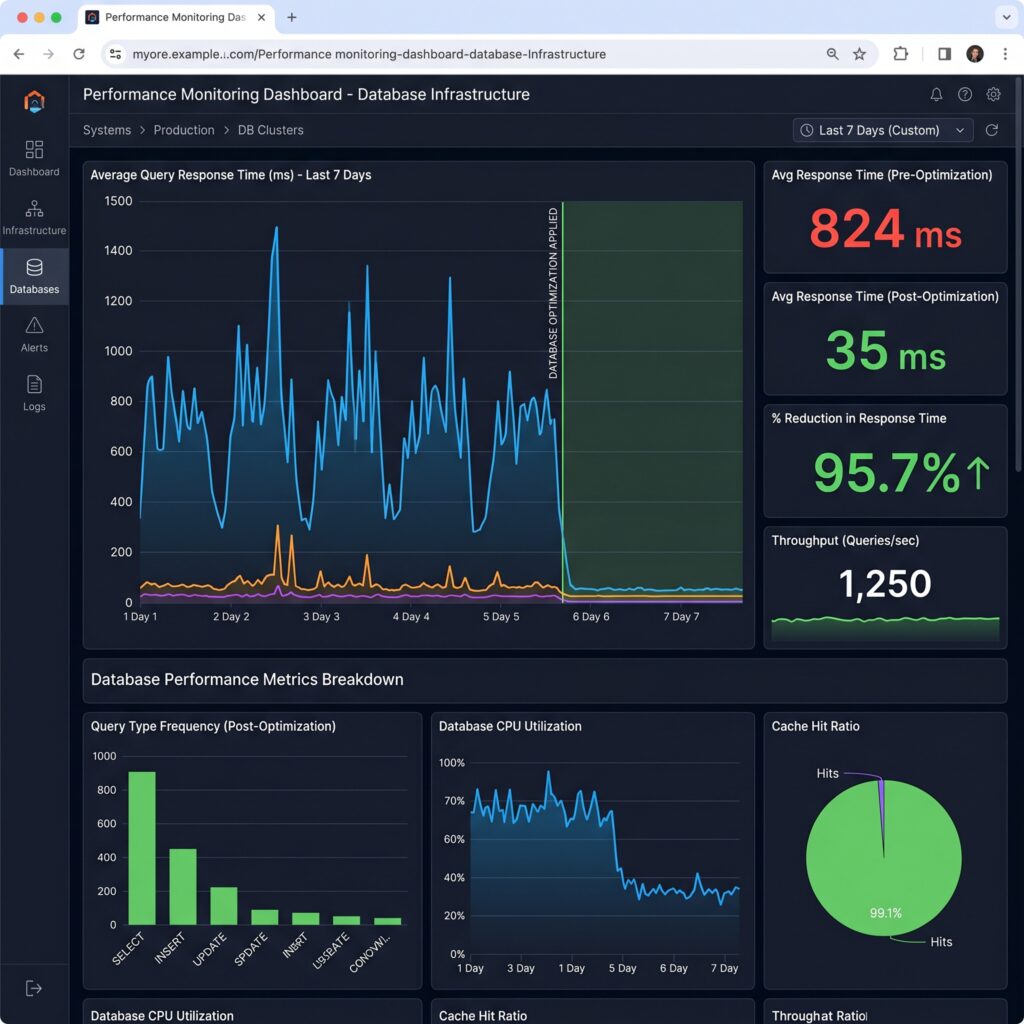
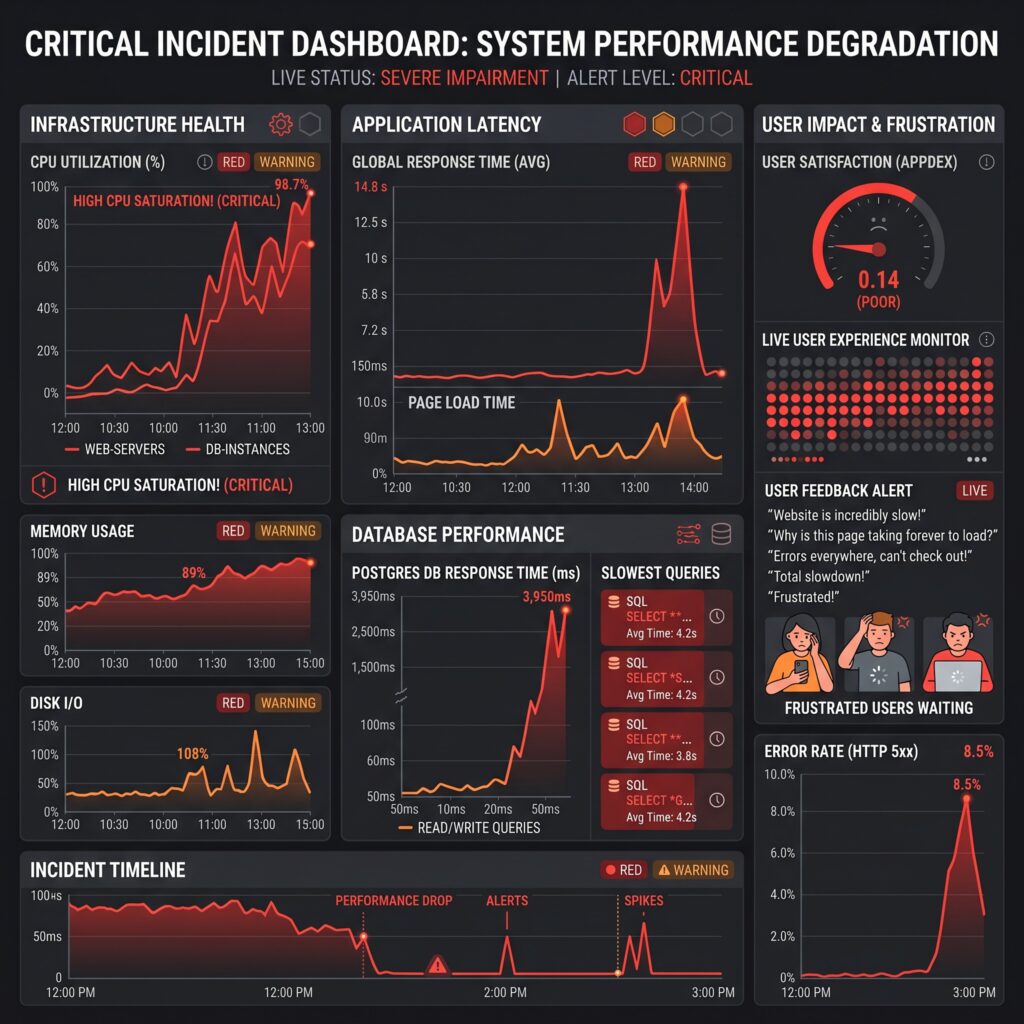
“Performance monitoring dashboard showing dramatic reduction in query response time after database optimization.”
Section 6: Database Performance Monitoring Tools
Optimization without monitoring is guesswork.
The following tools help identify bottlenecks.
PostgreSQL EXPLAIN ANALYZE
Shows:
- Actual execution time
- Row counts
- Execution strategy
Example:
EXPLAIN ANALYZE
SELECT *
FROM users
WHERE email='john@example.com';
Essential for PostgreSQL tuning.
pgAdmin
Provides:
- Query analysis
- Monitoring dashboards
- Index inspection
- Database statistics
Excellent PostgreSQL administration tool.
MySQL Workbench
Useful for:
- Query profiling
- Schema design
- Performance reports
SQL Server Profiler
Captures:
- Slow queries
- Execution details
- Resource usage
Popular in Microsoft environments.
New Relic
Application Performance Monitoring (APM).
Tracks:
- Query latency
- Transaction times
- Application bottlenecks
Datadog
Offers:
- Infrastructure monitoring
- Database metrics
- Alerting
Excellent for cloud-native environments.
Grafana
Visualization platform.
Common dashboards:
- CPU usage
- Memory usage
- Query throughput
- Slow query trends
Combines well with Prometheus.

“Modern database monitoring dashboard with query metrics, CPU utilization, memory usage, slow query tracking, and performance graphs.”
Best Practices Checklist
Use this checklist whenever evaluating database performance.
Query Design
✓ Avoid SELECT *
✓ Return only required columns
✓ Filter data efficiently
✓ Review expensive joins
✓ Use pagination properly
Indexing
✓ Create indexes on frequently filtered columns
✓ Index foreign keys
✓ Use composite indexes where appropriate
✓ Remove unused indexes
✓ Review index usage regularly
ORM Usage
✓ Detect N+1 queries
✓ Use eager loading
✓ Monitor generated SQL
✓ Avoid excessive lazy loading
Monitoring
✓ Analyze execution plans
✓ Monitor slow query logs
✓ Track CPU usage
✓ Track memory consumption
✓ Use performance dashboards
Scalability
✓ Use caching
✓ Batch inserts and updates
✓ Partition large tables
✓ Archive historical data
✓ Load test regularly
Conclusion
Slow database queries rarely happen because databases are inherently slow.
They happen because databases are asked to do unnecessary work.
Understanding how query execution works allows you to identify bottlenecks before they become production incidents. Learning how indexes function can turn multi-second queries into millisecond responses. Recognizing ORM pitfalls such as N+1 queries can eliminate hundreds of unnecessary database calls. Applying optimization techniques such as selective column retrieval, efficient joins, caching, partitioning, and proper pagination can dramatically improve system performance.
Most importantly, performance optimization should not be reactive.
The best engineering teams continuously monitor query performance, analyze execution plans, and optimize systems before scalability issues impact users.
Every slow query is a signal.
Listen to it early, investigate it thoroughly, and optimize it proactively. Doing so will help you build faster applications, reduce infrastructure costs, improve user experience, and create systems capable of handling growth without sacrificing performance.