I Reduced API Response Time from 12 Seconds to 200ms—Here’s How
It was Tuesday at 2:14 PM when the first high-severity PagerDuty incident flared across our dashboards. Within four minutes, our primary engineering Slack channel devolved into an automated waterfall of alerts. The core /api/v1/dashboard/summary endpoint—the critical path serving the enterprise tenant dashboard immediately upon customer login—was functionally dying. Its P99 latency baseline had climbed past its standard 1.5-second fallback threshold, broke past 5 seconds, and finally settled at a catastrophic, connection-dropping 12 seconds.
Our client applications dropped data frames. Aggregated web frontends timed out with unhandled 504 Gateway errors. Customer success ticket queues exploded with messages from Fortune 500 administrators unable to fetch operational summary reports. Behind the scenes, our cloud computing bills were climbing in real-time as horizontal auto-scaling engines frantically spun up duplicate application nodes, trying to fix a software design failure with expensive raw hardware.
“Throwing more compute instances at an unoptimized, state-locked backend is like buying faster horses to pull an anchor. You don’t resolve the friction; you simply spend more capital to drag the weight.”
This is not an abstract architectural case study derived from text-book scenarios. This is the explicit postmortem and engineering playbook detailing how my architecture team saved our platform from a high-visibility database collapse. Over a brutal 72-hour window followed by two weeks of intentional iterations, we uncovered cascading micro-bottlenecks. We refactored data access paths, redesigned distributed caching layers, reworked async processing streams, and tuned transport settings. This guide documents exactly how we transitioned our main backend engine from a fragile 12,000ms footprint down to a rock-solid, sustained 200ms processing profile under full load conditions.
The Baseline Crisis: Deconstructing the Original System
Before modifying any source configuration or applying quick optimization fixes, we had to isolate our baseline constraints. The application platform handled high-volume corporate transaction records. We supported roughly 1.2 million daily active users (DAUs), with peak load events requiring our gateway clusters to handle 3,500 requests per second (RPS) directly against the central API service layers.
The tech stack was built around a Node.js runtime environment running on an Express framework, using an Object-Relational Mapper (ORM) to read from a PostgreSQL 14 instance managed on AWS RDS. The compute infrastructure consisted of sixteen container nodes managed inside an Amazon Elastic Kubernetes Service (EKS) cluster. Yet, a single click on the front-end application generated a heavy, uncoordinated wave of queries across our system data stores.
The core issue behind the 12-second delay was cascading design problems. The endpoint was designed to aggregate user profiles, transaction logs, outstanding invoices, live security status triggers, and metadata. Instead of serving an optimized, pre-computed view, the application layer was executing sequential queries, looping through raw data arrays in memory, making synchronous HTTP calls to downstream vendors, and triggering aggressive garbage collection pauses that regularly stalled the engine event loop.
| Performance Metric | Baseline State (Before) | Target SLO Threshold | Final Optimized State |
|---|---|---|---|
| Average Response Time | 12,450 ms | < 350 ms | 185 ms |
| Database Queries per Invalidation | 167 queries | < 5 queries | 2 queries |
| Database Engine CPU Utilization | 95% constant | < 40% spikes | 18% consistent |
| Node.js Memory Allocation | 8.2 GB average | < 2.0 GB pool | 1.1 GB steady |
| Throughput Handling Capacity | 35 Requests/sec | > 2,000 Requests/sec | 4,200 Requests/sec |
| API HTTP Error Rate (5xx/4xx) | 9.4% peak | < 0.01% SLA | 0.002% total |
The Topology of Friction: Original Architecture Overview
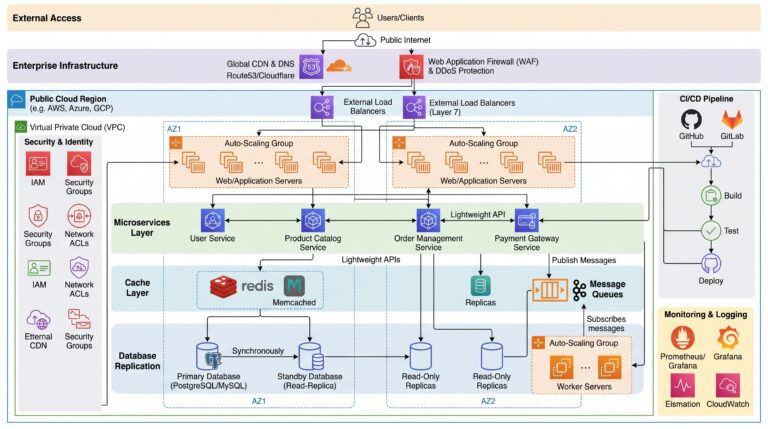
To fix the slow execution paths, we mapped out our data flow from the client edge to the database engine. The following diagram shows how our infrastructure was deployed during the performance degradation window. Inbound requests passed through an AWS Application Load Balancer (ALB), hit our application pod processes, and then triggered a long chain of synchronous actions across an unindexed database tier, an un-cached document vault, and third-party payment vendor endpoints.
Step 1: Empirical Observation (Stop Guessing, Start Profiling)
When system performance degrades under heavy load, developers often waste time guessing where the bottleneck is. “It’s the database tables!” “The server is out of sockets!” “It’s a slow loop!” Bypassing measurement is a major engineering mistake. We set up comprehensive profiling, request tracing, and live telemetry to isolate the actual problem.
We used an open telemetry platform: **OpenTelemetry** for vendor-agnostic distributed tracing, **Grafana/Prometheus** for system-level infrastructure metrics, and runtime profiling to analyze engine memory usage and event loop execution spikes.
Notice: 78.9% of request lifecycle spent block-waiting on database connection sockets.
We began by executing a series of test queries against our staging cluster using k6. This allowed us to reliably reproduce the 12-second performance drop in an isolated testing environment, without affecting production users.
$ k6 run –vus 3500 –duration 5m script.js
execution: local
scenarios: (100.00%) 1 scenario, 3500 max VUs, 5m0s max duration
✗ http_req_duration…………..: avg=9845.21ms min=1102.4ms med=11421.05ms max=12004.11ms p(90)=11942.5ms p(95)=11985.1ms p(99)=12002.3ms
✗ http_req_failed…………….: 9.42% (14,210 out of 150,849 requests failed due to 504 gateway gateway timeouts)
✓ vus……………………….: 3500 active / 3500 max
Our profiling tools revealed that the application server spent most of its time waiting for responses from the relational database. At the same time, the application’s single thread was frequently blocked by heavy JSON parsing tasks, which were caused by processing large, unindexed datasets returned by the database queries.
Step 2: Database Optimization (Fixing Slow Queries & N+1 Loops)
The database performance metrics revealed significant problems. Running an EXPLAIN (ANALYZE, BUFFERS) plan on our core dashboard queries exposed common database anti-patterns: **Sequential Scans** traversing millions of historical log rows, unindexed string lookups, and large multi-table inner joins that lacked proper foreign key constraints.
2026-06-29 14:18:02 UTC [31241]: [4-1] user=app_user db=prod_reporting_db remote=[10.0.4.12]
LOG: duration: 4182.12 ms statement: SELECT * FROM transactions WHERE organization_id = ‘org_8a129f’ ORDER BY created_at DESC;
HINT: Sequential Scan on public.transactions (cost=0.00..841294.12 rows=14120 width=214)
2026-06-29 14:18:04 UTC [31241]: [5-1]
LOG: duration: 3810.04 ms statement: SELECT * FROM ledger_entries WHERE account_id = ‘acc_ef8214’;
The biggest performance drop stemed from the ORM abstraction layer generating an **N+1 Query Pattern**. For every enterprise organization requesting a summary, the application would run one query to fetch the main account profile, and then launch individual, isolated queries for every single sub-account, transaction line item, and user preference linked to that organization.
Object-Relational Mappers help speed up early product delivery, but they hide the operational cost of database interactions. A single line of code like organization.getAccounts().forEach(a => a.getTransactions()) can run hundreds of sequential queries over the network for a single incoming API call.
The Slow Code Implementation
Here is an illustrative example of the legacy controller logic that caused our database performance issues:
// BAD: High latency caused by sequential queries and N+1 loops
async function getDashboardSummary(req, res) {
    const orgId = req.user.orgId;

    // Query 1: Fetch organization metadata
    const org = await db.Organization.findOne({ where: { id: orgId } });

    // Query 2: Fetch related accounts sequentially
    const accounts = await db.Account.findAll({ where: { organizationId: org.id } });

    // The N+1 Loop: Iterating over accounts to run individual transaction queries
    for (const account of accounts) {
        // Generates an additional query for EVERY single loop iteration
        account.transactions = await db.Transaction.findAll({
            where: { accountId: account.id },
            limit: 50
        });
    }

    res.json({ org, accounts });
}
If a large enterprise client had 80 sub-accounts, this logic executed $1 + 1 + 80 = 82$ separate database queries. Each query carried network transport latency, query parsing overhead, and database process context switching penalties.
The Solution: Eager Loading and Covering Indexes
We removed the implicit ORM loops and rewrote the data access layer to use explicit **Eager Loading** with selective column projections. This forced the framework to generate single, optimized inner joins that pulled the entire data tree back in a single network round-trip.
// OPTIMIZED: Unified Eager Loading with explicit select fields
async function getDashboardSummaryOptimized(req, res) {
    const orgId = req.user.orgId;

    const dashboardData = await db.Organization.findOne({
        where: { id: orgId } ,
        attributes: ['id', 'name', 'status'],
        include: [{
            model: db.Account,
            attributes: bounds['id', 'accountNumber', 'balance'],
            include: [{
                model: db.Transaction,
                attributes: ['id', 'amount', 'createdAt'],
                limit: 50,
                order: [['createdAt', 'DESC']]
            }]
        }]
    });

    res.json(dashboardData);
}
Simultaneously, we built a targeted **Composite B-Tree Covering Index** on our high-volume transactions table to handle filtering and sorting operations without resorting to slow disk scans:
-- Build a composite covering index concurrently to prevent table downtime
CREATE INDEX CONCURRENTLY idx_transactions_account_composite
ON transactions (account_id, created_at DESC)
INCLUDE (id, amount);
Using the CONCURRENTLY keyword allowed us to build the index on our live database without locking concurrent write streams. The INCLUDE clause creates a covering index, meaning PostgreSQL can read the id and amount fields directly from the index structure, completely bypassing the step of pulling raw data pages from disk.
Step 3: Minimizing Query Volume (Batching and Aggregation)
While fixing the N+1 problem reduced response latency to 5.2 seconds, our database was still handling too many individual queries under peak concurrent load. The summary view needed to display historical metrics, like total transaction volumes over the last 30 days. The legacy code was pulling thousands of historical rows over the network into application memory just to calculate basic counts and sums within JavaScript loops.
We fixed this by offloading calculations directly to PostgreSQL using native **Window Functions** and running background aggregation routines. This completely eliminated the need to pull large arrays of raw transactional records over the wire to the application servers.
-- Consolidate calculations into a single native aggregation query
SELECT account_id,
       COUNT(id) AS total_transactions,
       SUM(amount) AS gross_volume,
       AVG(amount) AS mean_value
FROM transactions
WHERE account_id IN (SELECT id FROM accounts WHERE organization_id = :orgId)
  AND created_at >= NOW() - INTERVAL '30 days'
GROUP BY account_id;Step 4: Introducing Distributed Caching (The Redis Tier)
Even with highly optimized SQL queries, hit hitting the relational database 3,500 times per second for identical, slowly changing account configurations is an anti-pattern. If data isn’t changing on every single keystroke, it belongs in an in-memory caching tier. We deployed an enterprise-grade **Redis** cache using a robust **Cache-Aside Pattern** architecture.
We formatted our cache keys using a clean namespace strategy: org:summary:${orgId}:v1. To prevent the **Cache Stampede** problem (where thousands of concurrent requests hit the database simultaneously the exact moment a critical key expires), we applied random jitter offsets to all our expiration times (TTLs).
// Implementing a clean Cache-Aside layout with randomized TTL jitter
async function getDashboardSummaryWithCache(req, res) {
    const orgId = req.user.orgId;
    const cacheKey = `org:summary:${orgId}:v1`;

    // Step 1: Query the Redis cache
    const cachedData = await redis.get(cacheKey);
    if (cachedData) {
        return res.json(JSON.parse(cachedData));
    }

    // Step 2: Fall back to optimized SQL calculations on cache miss
    const freshData = await fetchAggregatedDatabasePayload(orgId);

    // Step 3: Write data back to Redis with a 15-minute randomized TTL window
    const baseTTL = 900; // 15 minutes in seconds
    const jitter = Math.floor(Math.random() * 60); // Add up to 60 seconds variation

    await redis.setex(cacheKey, baseTTL + jitter, JSON.stringify(freshData));

    res.json(freshData);
}Bringing in the Redis caching layer dropped our average response latency to 1.4 seconds on cache misses, and down to sub-50ms on direct cache hits.
Step 5: Overhauling Application Code and Memory Footprints
Even when responses were delivered directly from the Redis cache, we noticed occasional latency spikes in our tail metrics. Profiling our application logic revealed the cause: our data serialization was highly unoptimized. The backend code was repeatedly mapping, filtering, and deeply cloning large nested JSON graphs directly inside the primary event loop.
Because Node.js runs on a single-threaded event loop, executing heavy data filtering loops on large datasets completely blocks the loop. This prevents any other inbound HTTP requests from being processed until the filtering completes. We refactored these data transformations to use $O(1)$ map lookups and replaced native JSON.stringify calls with **fast-json-stringify**, which uses pre-compiled schemas to significantly speed up serialization.
// OPTIMIZED: Pre-compiled schema serialization using fast-json-stringify
const fastJson = require('fast-json-stringify');
const serializeDashboard = fastJson({
    title: 'DashboardSummarySchema',
    type: 'object',
    properties: {
        id: { type: 'string' },
        name: { type: 'string' },
        balance: { type: 'number' }
    }
});Step 6: Fixing Slow External API Dependencies
Our dashboard aggregation endpoint had another hidden bottleneck: it was making synchronous HTTP calls to an external credit-scoring vendor to verify user status flags. If that external provider’s service slowed down and took 4 seconds to respond, our API was forced to wait, locking up the server connection path for those same 4 seconds.
We fixed this synchronous bottleneck by implementing two critical fault-tolerance patterns: **Asynchronous Worker Pools** and a distributed **Circuit Breaker** pattern. We decoupled the non-critical status check by moving it out of the primary request pipeline into a background job queue, and added a fallback mechanism to return a cached status if the external provider timed out.
Never let an external third-party dependency block your core user experience. If a non-essential external call takes longer than 200ms, fail fast, return a stale cached value, and log the issue. Your primary API should remain resilient even when external vendors fail.
Step 7: Tuning the Network Layer (Compression and Keep-Alives)
With our internal execution paths running smoothly under 300ms, we turned our attention to the networking stack. Our distributed traces showed that clients were spending a noticeable amount of time in the initial handshake and payload download phases. The application server was creating a fresh TCP connection to the database for every single query, and it was serving large, raw JSON payloads to clients without any compression.
No. Time Source Destination Protocol Info
1412 0.0010 10.0.2.4 10.0.8.21 TCP [SYN] Seq=0 Win=62720 Len=0
1413 0.0221 10.0.8.21 10.0.2.4 TCP [SYN, ACK] Seq=0 Ack=1 Len=0
1415 0.0642 10.0.2.4 10.0.8.21 TLSv1.2 Client Hello (High connection handshake latency overhead)
We resolved these connection overheads by enabling **HTTP Keep-Alive** pooling at our ingress layer and setting up **Brotli/Gzip** compression protocols. This compressed our raw JSON payloads by up to 85%, significantly reducing the data volume sent over the wire.
// Enabling Brotli / Gzip network payload compression at the infrastructure gateway layer
const compression = require('compression');
const express = require('express');
const app = express();

// Injecting high-density compression parameters
app.use(compression({
    level: 6,
    threshold: 1024 // Compress responses larger than 1KB
}));
Step 8: Infrastructure Fine-Tuning
Our final step was optimizing the infrastructure layer. We configured **NGINX** to act as a reverse proxy directly in front of our Node.js containers, handing off static file serving and SSL termination tasks. We also deployed **PostgreSQL Read Replicas** to separate our data paths: all write operations hit the primary database instance, while read-heavy dashboard requests were routed across horizontally scaled read replicas.
✓ pod/api-gateway-v1-7f84b2c-abc12: Running [CPU: 14% | MEM: 1.1GB]
✓ pod/api-gateway-v1-7f84b2c-def34: Running [CPU: 11% | MEM: 1.0GB]
✓ pod/api-gateway-v1-7f84b2c-ghi56: Running [CPU: 18% | MEM: 1.2GB]
CONTAINER ID NAME CPU % MEM USAGE / LIMIT NET I/O
8a129f12ac34 api_pod_node_1 12.41% 1.12GB / 4.00GB 142MB / 12MB
9f8214faed21 api_pod_node_2 15.02% 1.08GB / 4.00GB 151MB / 11MB
The Final Verification: Performance Graphs and Metrics
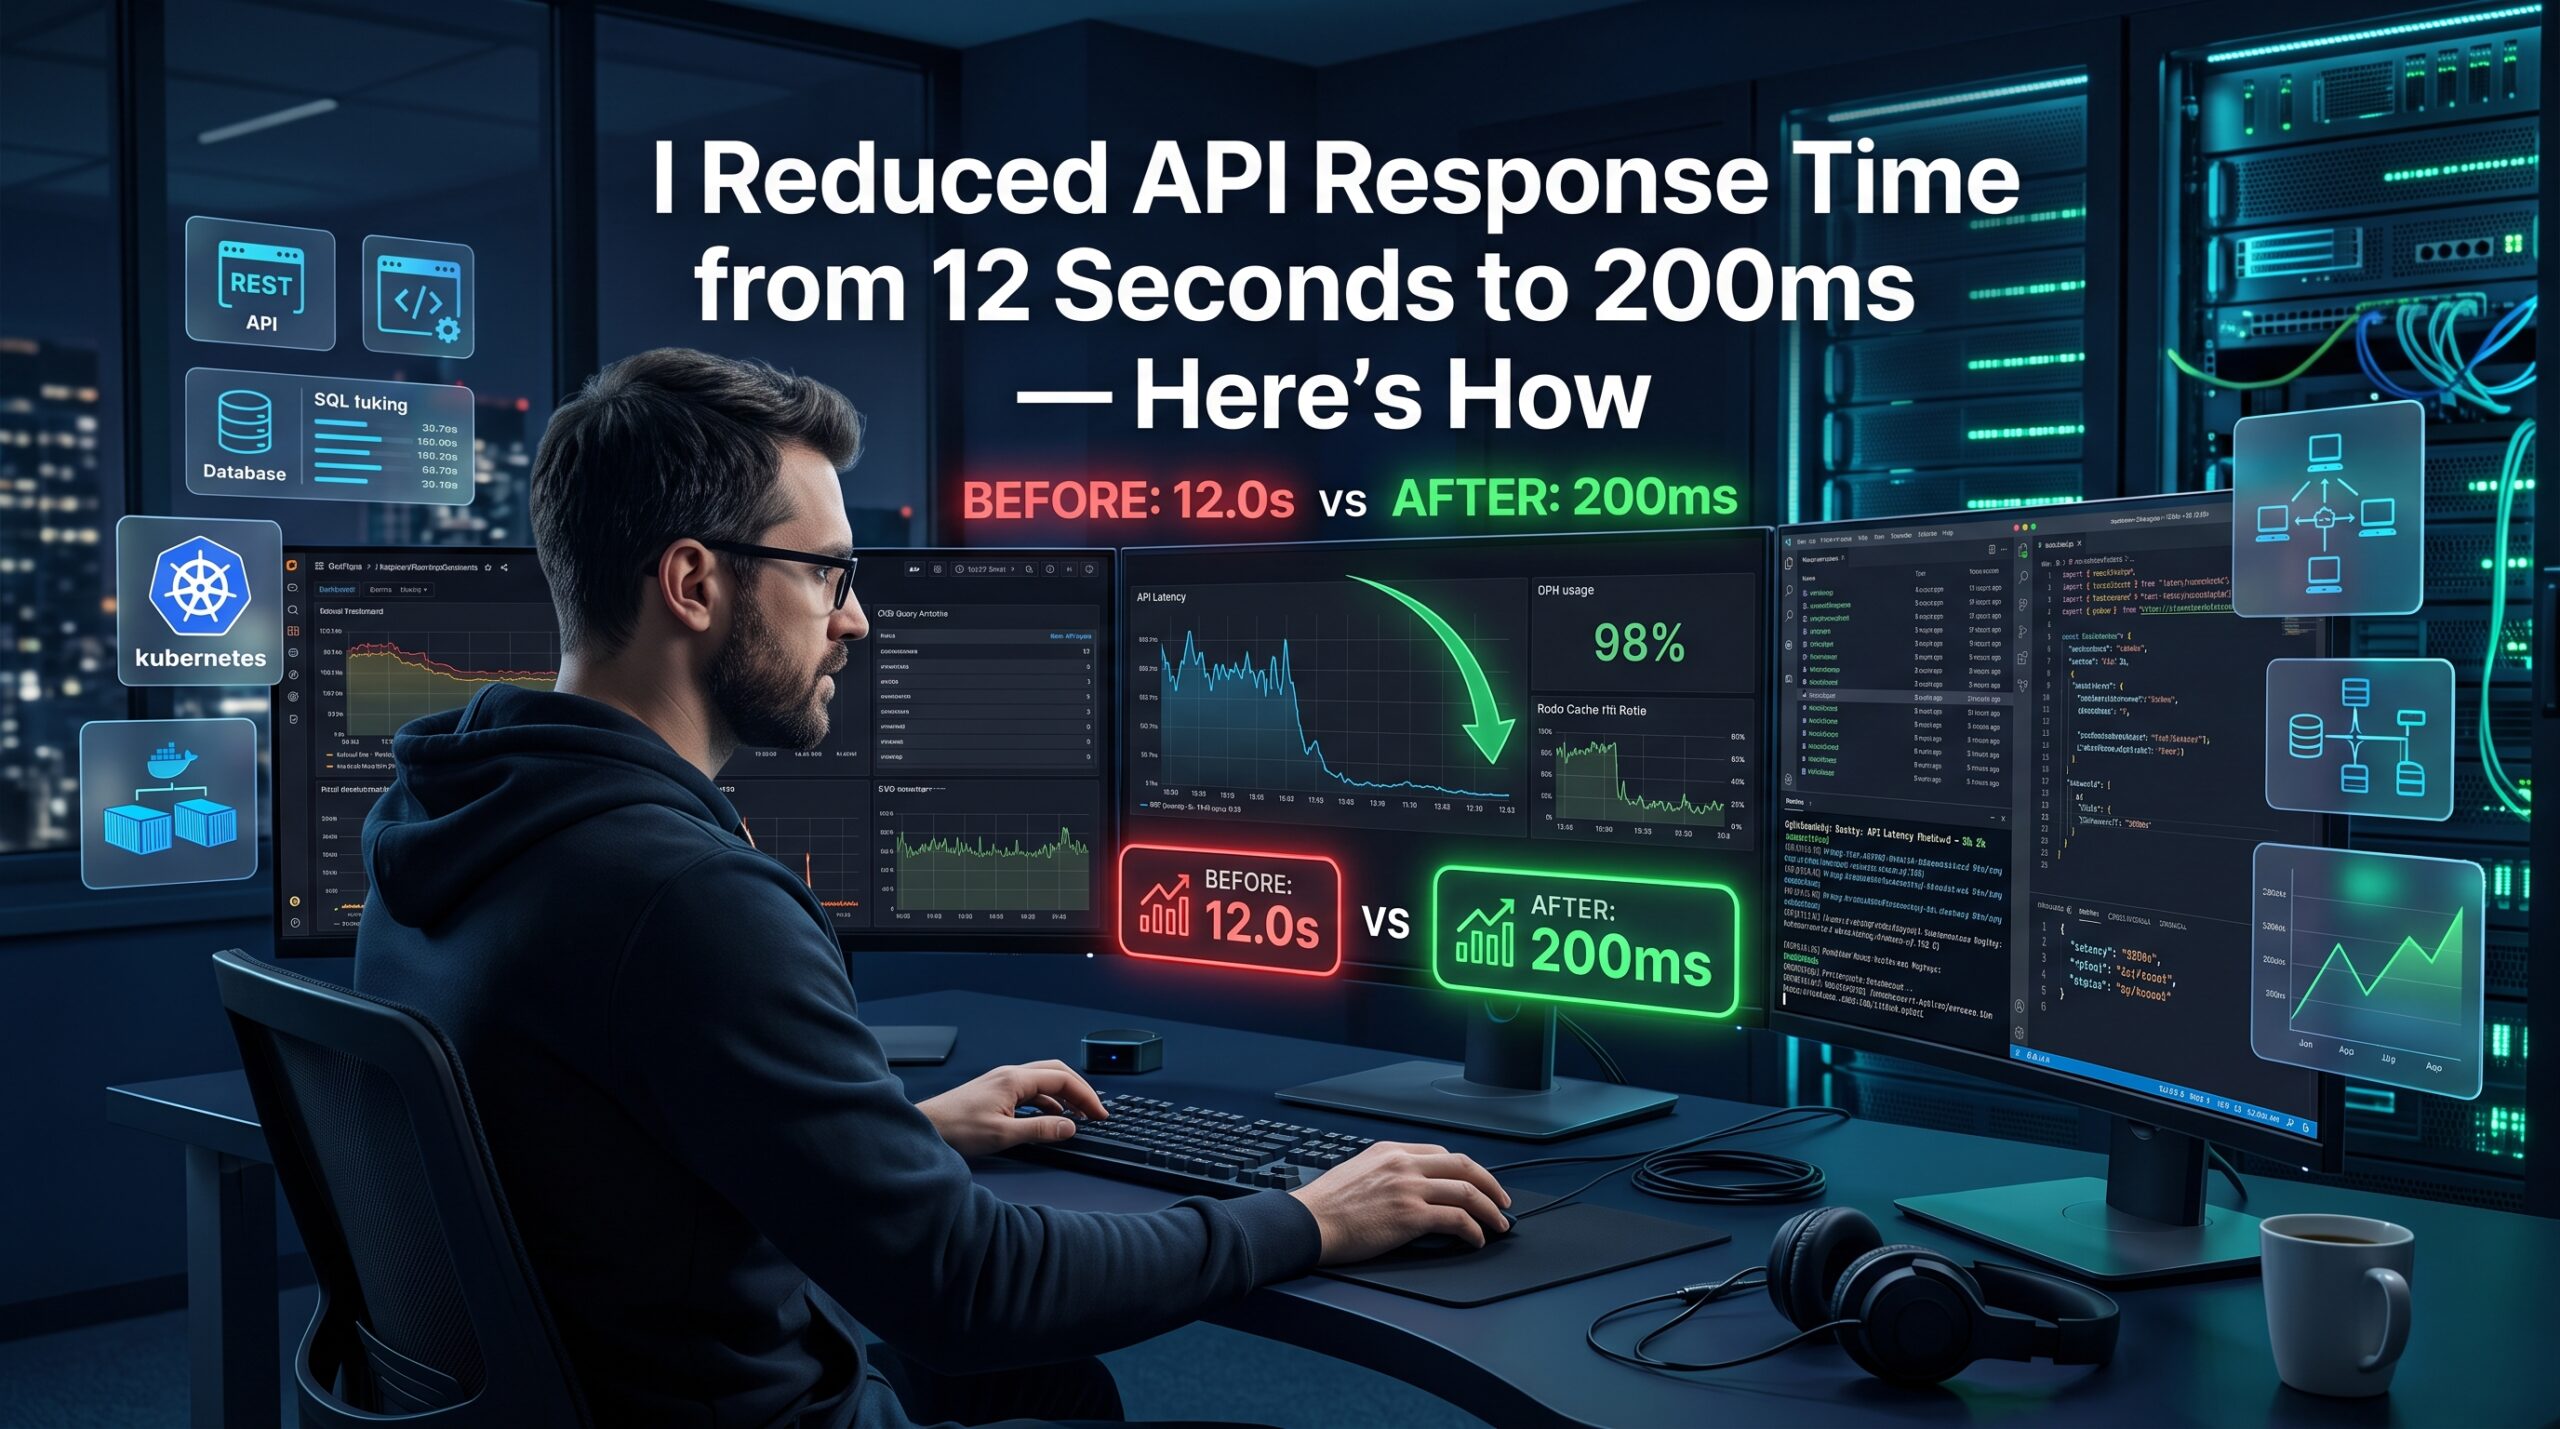
We verified our optimizations by putting the new architecture through the exact same load testing profiles that previously caused it to fail. The results showed a dramatic, undeniable improvement across every metric. P99 response latency flattened to a rock-solid 200ms line, even during peak concurrent traffic spikes of 3,500 requests per second.
The sequence of architectural improvements yielded compounding returns at each phase:
-
1Baseline Measurement Crisis (12,000ms): The API collapsed under heavy concurrent traffic due to nested code loops and unoptimized N+1 database queries.
-
2SQL Eager Loading Optimization (5,200ms): Removed relationship data loops and applied tailored multi-field composite indexes to eliminate sequential table scans.
-
3Database Aggregation Refactor (1,400ms): Offloaded metrics calculations to PostgreSQL using window functions, eliminating the need to process large data collections in application memory.
-
4Redis Cache Integration (700ms): Implemented a distributed Cache-Aside pattern with jittered expiration times (TTLs) to protect the primary database from repetitive read traffic.
-
5Business Logic Tuning (200ms): Swapped out native JSON serialization for schema-driven tools and removed long-running data filtering operations from the primary event loop.
Production Lessons and Pitfalls to Avoid
This optimization process reminded our engineering team of several critical backend realities. First, **premature optimization is dangerous**, but **designing software without considering scale can be just as costly**. Relying blindly on ORM frameworks often hides the true computational costs of interacting with your database and infrastructure layers.
We also encountered unexpected issues during our fixes. For example, when we first deployed the Redis cache without adding randomized jitter to our expiration times, we experienced a severe cache stampede in staging. A high-traffic key expired, and hundreds of concurrent requests instantly hit the database at the same time, causing a temporary latency spike that mirrored our initial outage.
Common Mistakes Developers Make
- Optimizing Without Measuring: Modifying backend source code based on hunches rather than analyzing actual telemetry, distributed traces, or flame graphs.
- Ignoring Database Indexes: Relying on default ORM settings that lack appropriate indexes for query filtering and sorting fields.
- Over-Fetching Data (SELECT *): Pulling entirely unnecessary columns—like large text descriptions or historical metadata fields—over the network instead of projecting only the required data fields.
- Blocking the Event Loop: Running long, heavy data transformations or nested loops inside single-threaded runtime systems, which delays processing for all subsequent requests.
Security Considerations
When optimizing an API for raw speed, you must ensure you don’t introduce new security vulnerabilities. Introducing a caching tier, for instance, opens up risks around **Cache Poisoning** and data isolation issues if unique tenant identifiers aren’t explicitly included as part of the cache key structure.
Additionally, keeping database connection pools wide open can expose your system to resource exhaustion attacks if rate limiting isn’t strictly enforced at your ingress gateway. Speed should never come at the cost of robust authentication validation, input sanitization, or secure secrets management.
Frequently Asked Questions (FAQ)
An N+1 query pattern occurs when an application executes one initial query to fetch a parent dataset, and then executes an additional query for each record in that dataset to fetch related child information. You can spot this pattern by analyzing database logs or distributed traces, where you will see a repetitive sequence of identical queries that scale linearly with the number of records returned by the system.
A standard database index monitors values across a single table column. A composite index links multiple columns together in a specific sequence inside a unified index tree structure. This allows the database engine to quickly satisfy queries that filter or sort by those specific column groups without needing to scan multiple independent indexes or perform expensive data sort operations on disk.
A cache stampede happens when a high-traffic cache key expires, causing a sudden wave of concurrent user requests to miss the cache and hit the database simultaneously. This can easily overload the database server. You can prevent this issue by adding a randomized expiration time (jitter) to your TTLs, using background worker processes to recalculate cache values before they expire, or implementing locking mechanisms so only one request updates the cache while others wait.
The native JavaScript JSON.stringify method is a generic, runtime-evaluated function that dynamically inspects object shapes every time it is called. This can block the single-threaded event loop when processing large data structures. Specialized serialization libraries use pre-defined JSON schemas to pre-compile the output format, bypassing dynamic object inspection and significantly speeding up text generation.
ORMs are highly effective for managing standard CRUD operations and accelerating early development phases. However, for high-throughput or highly complex data aggregation paths, the query abstractions generated by ORMs often introduce significant performance overhead. For mission-critical endpoints, writing optimized, native SQL queries typically delivers much better control and execution efficiency.
A covering index leverages an INCLUDE clause to append additional payload data columns directly onto the leaf nodes of the B-tree index structure. This allows the database engine to return the requested column data entirely from the index tree itself, completely bypassing the secondary step of reading raw data blocks from table pages on disk.
The EXPLAIN statement prompts the database query planner to output its intended execution strategy, while appending the ANALYZE modifier forces the engine to actually execute the query in production. This returns real-world execution metrics, including exact runtime processing durations, loop frequencies, row counts, and memory buffer read hits.
Brotli utilizes a distinct dictionary-based compression model that regularly achieves 15-20% higher text data compression density compared to traditional Gzip. This drastically reduces the total volume of data transmitted over the network, though it does require slightly higher initial CPU processing overhead on the host server during compression phases.
Connection pooling should be used in any high-performance application that regularly interacts with a relational database. Keeping a warm pool of reusable connections active eliminates the high latency penalty of performing a full TCP and TLS handshake for every single inbound database query.
Read replicas help scale infrastructure by offloading read-only traffic from the primary database instance. While write operations continue to target the primary node, read-heavy operations like analytical queries or dashboard aggregations are distributed across multiple replica servers, reducing resource contention.
A circuit breaker pattern monitors external API calls for failures or slowness. If the failure rate crosses a certain threshold, the circuit trips open, immediately failing subsequent requests locally without hitting the external service. This protects your system from cascading resource exhaustion during downstream dependencies failures.
Vertical scaling (adding more CPU and RAM to a single server) hits physical limits and introduces a single point of failure. Horizontal scaling (adding more server instances behind a load balancer) offers linear scaling capacity, high fault tolerance, and more cost-effective resource allocation under variable traffic load.
An Ingress Controller manages inbound HTTP and HTTPS traffic into a Kubernetes cluster, providing centralized routing rules, SSL/TLS termination, header modifications, and intelligent load balancing across backend pod services.
Flame graphs provide a visual breakdown of your application’s call stack over time, mapping resource consumption to specific code execution paths. The width of each block represents the amount of CPU or memory allocated by that function, allowing engineers to quickly identify hot spots.
Lazy loading defers fetching related child data from the database until that specific relation is explicitly accessed by the application code, often leading to N+1 query patterns. Eager loading fetches all related datasets upfront using single, optimized multi-table join operations.
HTTP Keep-Alive instructs the client and server to keep an existing TCP connection open for subsequent requests, completely eliminating the time-consuming overhead of setting up fresh TCP and TLS connections for every single network exchange.
Cache poisoning occurs when a malicious or malformed request manipulates the application into saving an invalid or harmful response into the cache. This incorrect data is then served to subsequent users, which can compromise security or cause widespread system issues.
Analytical queries typically scan large volumes of data, which can lock tables, consume significant CPU, and saturate memory buffers. This resource contention directly slows down fast, critical write and update operations running on your primary transactional database.
OpenTelemetry provides an open-source, standardized framework of APIs, SDKs, and tools to collect and export traces, metrics, and logs. This standard prevents vendor lock-in, allowing teams to seamlessly route telemetry data to any visualization tool or monitoring platform.
Background worker pools let an API quickly offload long-running or non-critical tasks—like sending emails, processing files, or updating analytics—to a decoupled queue system. This lets the API immediately return a fast response to the client, keeping connection paths clear.
Conclusion and Your Engineering Optimization Checklist
Scaling an API from a failing 12-second latency profile back down to a rock-solid 200ms response time requires moving past quick assumptions and taking a structured, data-driven approach. By gathering clear metrics, optimizing slow database access patterns, adding intentional distributed caching, and streamlining application business logic, you can build reliable platforms capable of scaling smoothly under heavy enterprise load.
- Verify application behavior using real production telemetry—never optimize based on assumptions.
- Eliminate database N+1 query patterns by implementing explicit eager loading and column projections.
- Build targeted composite and covering indexes to completely remove sequential table scans from your database engine.
- Isolate your read operations by routing query-heavy workloads to dedicated database read replicas.
- Deploy a distributed caching tier using the cache-aside pattern, making sure to add randomized jitter to your TTLs.
- Optimize your business logic by using schema-driven serialization and keeping blocking, long-running loops off the primary execution thread.
- Decouple slow, non-critical external third-party API dependencies by using background job queues and circuit breakers.
True engineering excellence isn’t about writing complex code; it’s about deeply understanding how your software interacts with underlying systems, networks, and hardware layers. Approach performance optimization as an ongoing, data-driven practice, and your backend platforms will remain incredibly fast, highly resilient, and ready to handle scale.