How to Scale an Application from 100 Users to 1 Million Users
⚡ Quick Answer — What is the best way to scale an application?
The best way to scale an application is incrementally: optimize your database with indexing and caching first, add a load balancer and horizontal servers next, introduce Redis and a CDN for 10,000+ users, and finally adopt auto-scaling, read replicas, and sharding as you approach millions of users. Measure before you build.
You've just shipped your app. One hundred users are happily clicking around, everything loads fast, and you're feeling great. Then a Hacker News post links to you overnight. By morning you have 40,000 concurrent visitors, and every single page is timing out.
This scenario plays out dozens of times a year. Usually it ends badly: a degraded user experience, a flood of angry tweets, and an engineering team frantically rebooting servers they don't understand. Sometimes it ends even worse: the company never recovers the trust it lost in that 45-minute window.
The uncomfortable truth is that building software and building scalable software are two different disciplines. A feature that works at 100 users can actively destroy your system at 10,000. The gap between the two is not just algorithmic, it's architectural, operational, and cultural.
There's a second trap that's equally dangerous: premature optimization. Spending six months building a distributed microservices mesh before you have product-market fit is a way to run out of runway before you find out whether anyone actually wants what you're building. Twitter ran on a monolith for years. Amazon started as a single-server bookstore. The goal isn't to design for a million users on day one it's to know the upgrade path so you're never caught flat-footed.
This guide walks through that entire journey: from the single server you start with to the globally distributed system you'll need when things really take off. Every stage has real bottlenecks, concrete solutions, and specific mistakes I've watched teams make in production.
Related Reading
Section 1: Understanding Scalability
Scalability is the capacity of a system to handle a growing workload by adding resources. But that one-line definition hides a lot. Scalability is closely related to but distinct from — several other properties engineers care about:
- Performance is how fast a system responds under a given load. A system can be performant at low traffic and still not scale.
- Scalability is how gracefully performance holds as load increases.
- Reliability is whether the system produces correct results consistently over time.
- Availability is the percentage of time the system is operational and reachable.
- Fault Tolerance is the ability to continue operating even when individual components fail.
You can have high performance without scalability (a single fast server that falls over at 5,000 users), and you can have high availability without performance (a redundant system that's always up but always slow). The goal at scale is all five, but the order in which you invest matters enormously.
Vertical Scaling — Scale Up
Vertical scaling means upgrading the machine: more CPU cores, more RAM, faster NVMe storage. It's the simplest possible scaling strategy because you don't change your application code or architecture at all — you just throw better hardware at the problem.
Advantages: Zero code changes, simple operations, no data partitioning complexity.
Disadvantages: Hard ceiling (you can't buy a server with 2 TB of RAM for reasonable money), single point of failure, expensive at the top end, requires downtime to upgrade.
Practical ceiling: Vertical scaling typically buys you one to two orders of magnitude before you hit diminishing returns on cost.
Horizontal Scaling — Scale Out
Horizontal scaling means running multiple copies of your application across multiple machines, with a load balancer distributing traffic between them. This is the strategy that powers every large-scale system you've ever used.
Advantages: Near-infinite ceiling, fault tolerant (one server dying doesn't take everything down), cheaper per unit of capacity at high scale.
Disadvantages: Your application must be stateless, session management gets complex, you need to think about distributed state, and operational complexity increases significantly.
| Factor | Vertical Scaling | Horizontal Scaling |
|---|---|---|
| Cost | High unit cost at upper tiers; linear pricing breaks down | Commodity hardware; cost scales linearly with demand |
| Complexity | Low — no code changes required | High — requires stateless app design, load balancers, distributed state |
| Max Capacity | Physical hardware limit (~a few TB RAM today) | Effectively unlimited; add nodes as needed |
| Reliability | Single point of failure | High — redundant nodes absorb failures |
| Maintenance | Upgrade requires planned downtime | Rolling deploys with zero downtime |
| Typical Use Cases | Databases, early-stage startups, legacy apps | Web servers, APIs, microservices at scale |
Section 2: The Growth Journey — 100 to 1 Million Users
Architecture should evolve with your traffic, not ahead of it. Here's a realistic breakdown of what each growth stage demands.
A single server handles everything: web tier, application logic, and database. This is the correct starting point.
- Single VPS or cloud instance
- Shared application + database server
- No cache layer needed
- Deploy whatever ships fastest
First bottlenecks appear. Slow queries surface. You realize you have no visibility into what's happening.
- Add APM (Datadog, New Relic)
- Profile and optimize slow queries
- Add database indexes
- Separate DB to its own server
Database contention is now real. API latency spikes under concurrent load. You need caching and a second app server.
- Introduce Redis for session + hot data
- Add a second application server + Nginx
- Read replica for heavy read queries
- Start async job queues (Sidekiq, Celery)
You can't throw more app servers at a slow database. You need a proper caching layer, CDN, and queue infrastructure.
- Redis Cluster for distributed cache
- CDN for all static assets
- Multiple read replicas
- Load balancer (AWS ALB or Nginx)
- Message queue (RabbitMQ, SQS, Kafka)
Enterprise-grade distributed architecture. Every component is redundant, monitored, and auto-scaling.
- Auto-scaling application clusters (k8s)
- Database sharding or NewSQL
- Global CDN edge nodes
- Multi-region active-active deployments
- Distributed tracing + alerting
- Chaos engineering + DR drills
Section 3: Scaling Databases
In almost every system I've worked on, the database was the first thing to buckle under load. Not the app servers. Not the network. The database. This is the section to get right.
Query Optimization — Start Here
Before you think about replicas or sharding, you need to know whether your queries are actually efficient. A single full-table scan on a 10 million-row table can destroy performance even on powerful hardware.
Consider a naive user lookup:
-- Full table scan: reads every row to find one
SELECT * FROM users
WHERE email = 'user@example.com';-- Create a unique B-tree index on email
CREATE UNIQUE INDEX idx_users_email ON users(email);
-- Now the same query uses an index lookup: O(log n) instead of O(n)
SELECT id, name, email, created_at FROM users
WHERE email = 'user@example.com';
-- Check your query plan to confirm
EXPLAIN ANALYZE SELECT id, name, email, created_at
FROM users WHERE email = 'user@example.com';Always EXPLAIN ANALYZE your queries in production. An index that looks obvious in development may be unused if the query planner decides a sequential scan is cheaper on a small dataset — but that same plan will be catastrophic at scale.
Indexing Strategy
- B-tree indexes — the default; excellent for equality and range queries on sortable types.
- Composite indexes — index multiple columns together. The order matters:
(user_id, created_at)is useful for "all posts by user X, sorted by date" but not for "all posts on date Y." - Covering indexes — include all columns a query needs in the index itself so the DB never touches the main table.
-- Efficient for: WHERE user_id = 42 ORDER BY created_at DESC
CREATE INDEX idx_posts_user_created
ON posts(user_id, created_at DESC);

-- Covering index: query answered entirely from index, zero heap access
CREATE INDEX idx_posts_covering
ON posts(user_id, created_at DESC)
INCLUDE (title, status);
Read Replicas
For read-heavy applications (most web apps read far more than they write), the fastest win after indexing is adding a read replica. Your primary database handles all writes. One or more read-only replicas serve all read queries. Replication lag is typically under 100ms on well-configured systems, which is acceptable for most use cases.
import psycopg2

PRIMARY_DSN   = "postgresql://primary-host:5432/mydb"
REPLICA_DSN   = "postgresql://replica-host:5432/mydb"

def get_connection(write=False):
    dsn = PRIMARY_DSN if write else REPLICA_DSN
    return psycopg2.connect(dsn)

# Reads go to replica
with get_connection(write=False) as conn:
    cursor = conn.cursor()
    cursor.execute("SELECT * FROM products WHERE category = %s", ["electronics"])

# Writes go to primary
with get_connection(write=True) as conn:
    cursor = conn.cursor()
    cursor.execute("INSERT INTO orders (user_id, total) VALUES (%s, %s)", [42, 99.99])
    conn.commit()
Database Partitioning and Sharding
Vertical partitioning means splitting a wide table into narrower tables — putting rarely-accessed columns (like a large bio text field) in a separate table. This keeps the hot columns in memory more effectively.
Horizontal partitioning (sharding) means splitting rows across multiple databases based on a shard key — for example, user IDs 1–1,000,000 on shard A, 1,000,001–2,000,000 on shard B. Instagram sharded early on Postgres. Uber built their own sharding layer. It's powerful and extremely painful to retrofit once you're already live — which is why teams like Pinterest moved to it at around 10 million users, before they absolutely had to.
Section 4: Load Balancing
Once you have more than one application server, something needs to decide which server handles each incoming request. That's a load balancer. It's one of the most important pieces of infrastructure you'll add.
What Load Balancers Solve
- Overload prevention — no single server takes all the traffic
- High availability — when a server fails, traffic is automatically rerouted
- Graceful deploys — drain one server, update it, put it back, repeat
- SSL termination — offload TLS decryption from app servers
Layer 4 vs Layer 7
Layer 4 (TCP/IP): Routes packets based on IP address and port only. It's fast and protocol-agnostic, but it can't inspect HTTP headers or cookies. Use for raw throughput.
Layer 7 (HTTP/HTTPS): Inspects the full request — URL, headers, cookies, request body. This lets you route /api/* to one cluster and /static/* to another. Most modern web architectures use Layer 7.
Configuration Example — Nginx
upstream backend_servers {
    least_conn;                        # route to server with fewest active connections
    server app-1.internal:8080 weight=3;
    server app-2.internal:8080 weight=3;
    server app-3.internal:8080 weight=2;
    keepalive 32;                      # maintain persistent connections to upstreams
}

server {
    listen 443 ssl http2;
    ssl_certificate     /etc/ssl/cert.pem;
    ssl_certificate_key /etc/ssl/key.pem;

    location / {
        proxy_pass http://backend_servers;
        proxy_http_version 1.1;
        proxy_set_header Connection "";
        proxy_set_header Host $host;
        proxy_set_header X-Real-IP $remote_addr;
        proxy_connect_timeout 5s;
        proxy_read_timeout    30s;
    }

    # Health check endpoint
    location /health {
        access_log off;
        proxy_pass http://backend_servers/health;
    }
}
Health Checks and Failover
A load balancer is only useful if it knows which servers are healthy. Configure health checks to poll each upstream every 5–10 seconds and remove unresponsive nodes automatically. AWS ALB, Nginx Plus, and HAProxy all support this natively. When a node fails its health check, traffic is redistributed within seconds.
Session Persistence
Stateless applications should never need sticky sessions — any server can handle any request because all state lives in Redis or the database. If you still have sticky sessions in your architecture, it's a sign you have application-level state that needs to be externalized. Sticky sessions kill your ability to drain and replace servers gracefully.
Section 5: Caching Strategies
If I had to choose one optimization with the highest impact-to-effort ratio, caching wins every time. A well-placed cache can reduce database load by 80–95% and cut response times from hundreds of milliseconds to under 5ms.
Types of Caching
- Browser caching —
Cache-Controlheaders keep static assets on the client - CDN caching — edge nodes serve cached content close to users, globally
- Application/API caching — cache expensive computed responses in Redis
- Database query caching — cache results of slow queries before they hit the DB
Redis vs Memcached
| Feature | Redis | Memcached |
|---|---|---|
| Data structures | Strings, lists, sets, sorted sets, hashes, streams | Strings only |
| Persistence | RDB snapshots + AOF log | None (memory only) |
| Clustering | Redis Cluster (native) | Client-side sharding only |
| Pub/Sub | Yes | No |
| Max throughput | ~1M ops/sec per node | ~1M ops/sec per node |
| Use Redis when | You need leaderboards, sessions, rate limiting, pub/sub, sorted data | |
| Use Memcached when | You need simple key-value caching with the absolute minimum overhead | |
Cache Patterns
Cache Aside
App checks cache first. On miss, fetches from DB, writes to cache, returns result. Cache and DB managed separately. Best for read-heavy workloads.
Read Through
Cache sits in front of DB. Cache handles misses automatically. App only talks to cache. Simpler code, consistent cache population.
Write Through
Every write goes to cache AND DB simultaneously. Cache always stays in sync. Strong consistency; higher write latency.
Write Behind
Writes go to cache immediately; DB updated asynchronously. Lowest write latency; risk of data loss on crash.
import redis
import json

r = redis.Redis(host="cache.internal", port=6379, decode_responses=True)
CACHE_TTL = 300  # 5 minutes

def get_user(user_id: int) -> dict:
    cache_key = f"user:{user_id}"

    # 1. Check cache
    cached = r.get(cache_key)
    if cached:
        return json.loads(cached)   # cache HIT

    # 2. Cache MISS — fetch from database
    user = db.query("SELECT * FROM users WHERE id = %s", [user_id])
    if user:
        # 3. Populate cache for next time
        r.setex(cache_key, CACHE_TTL, json.dumps(user))

    return user

def update_user(user_id: int, data: dict):
    db.execute("UPDATE users SET ... WHERE id = %s", [user_id])
    # Invalidate cache — force fresh read on next access
    r.delete(f"user:{user_id}")
Common Caching Mistakes
- Cache stampede — many simultaneous cache misses hit the DB at once. Fix with probabilistic early expiration or a distributed lock.
- Missing cache invalidation — stale data served after updates. Track dependencies explicitly.
- Caching too aggressively — caching data that changes frequently wastes memory and causes correctness bugs.
- No TTL — cached values that never expire grow stale silently.
Section 6: Microservices vs Monoliths
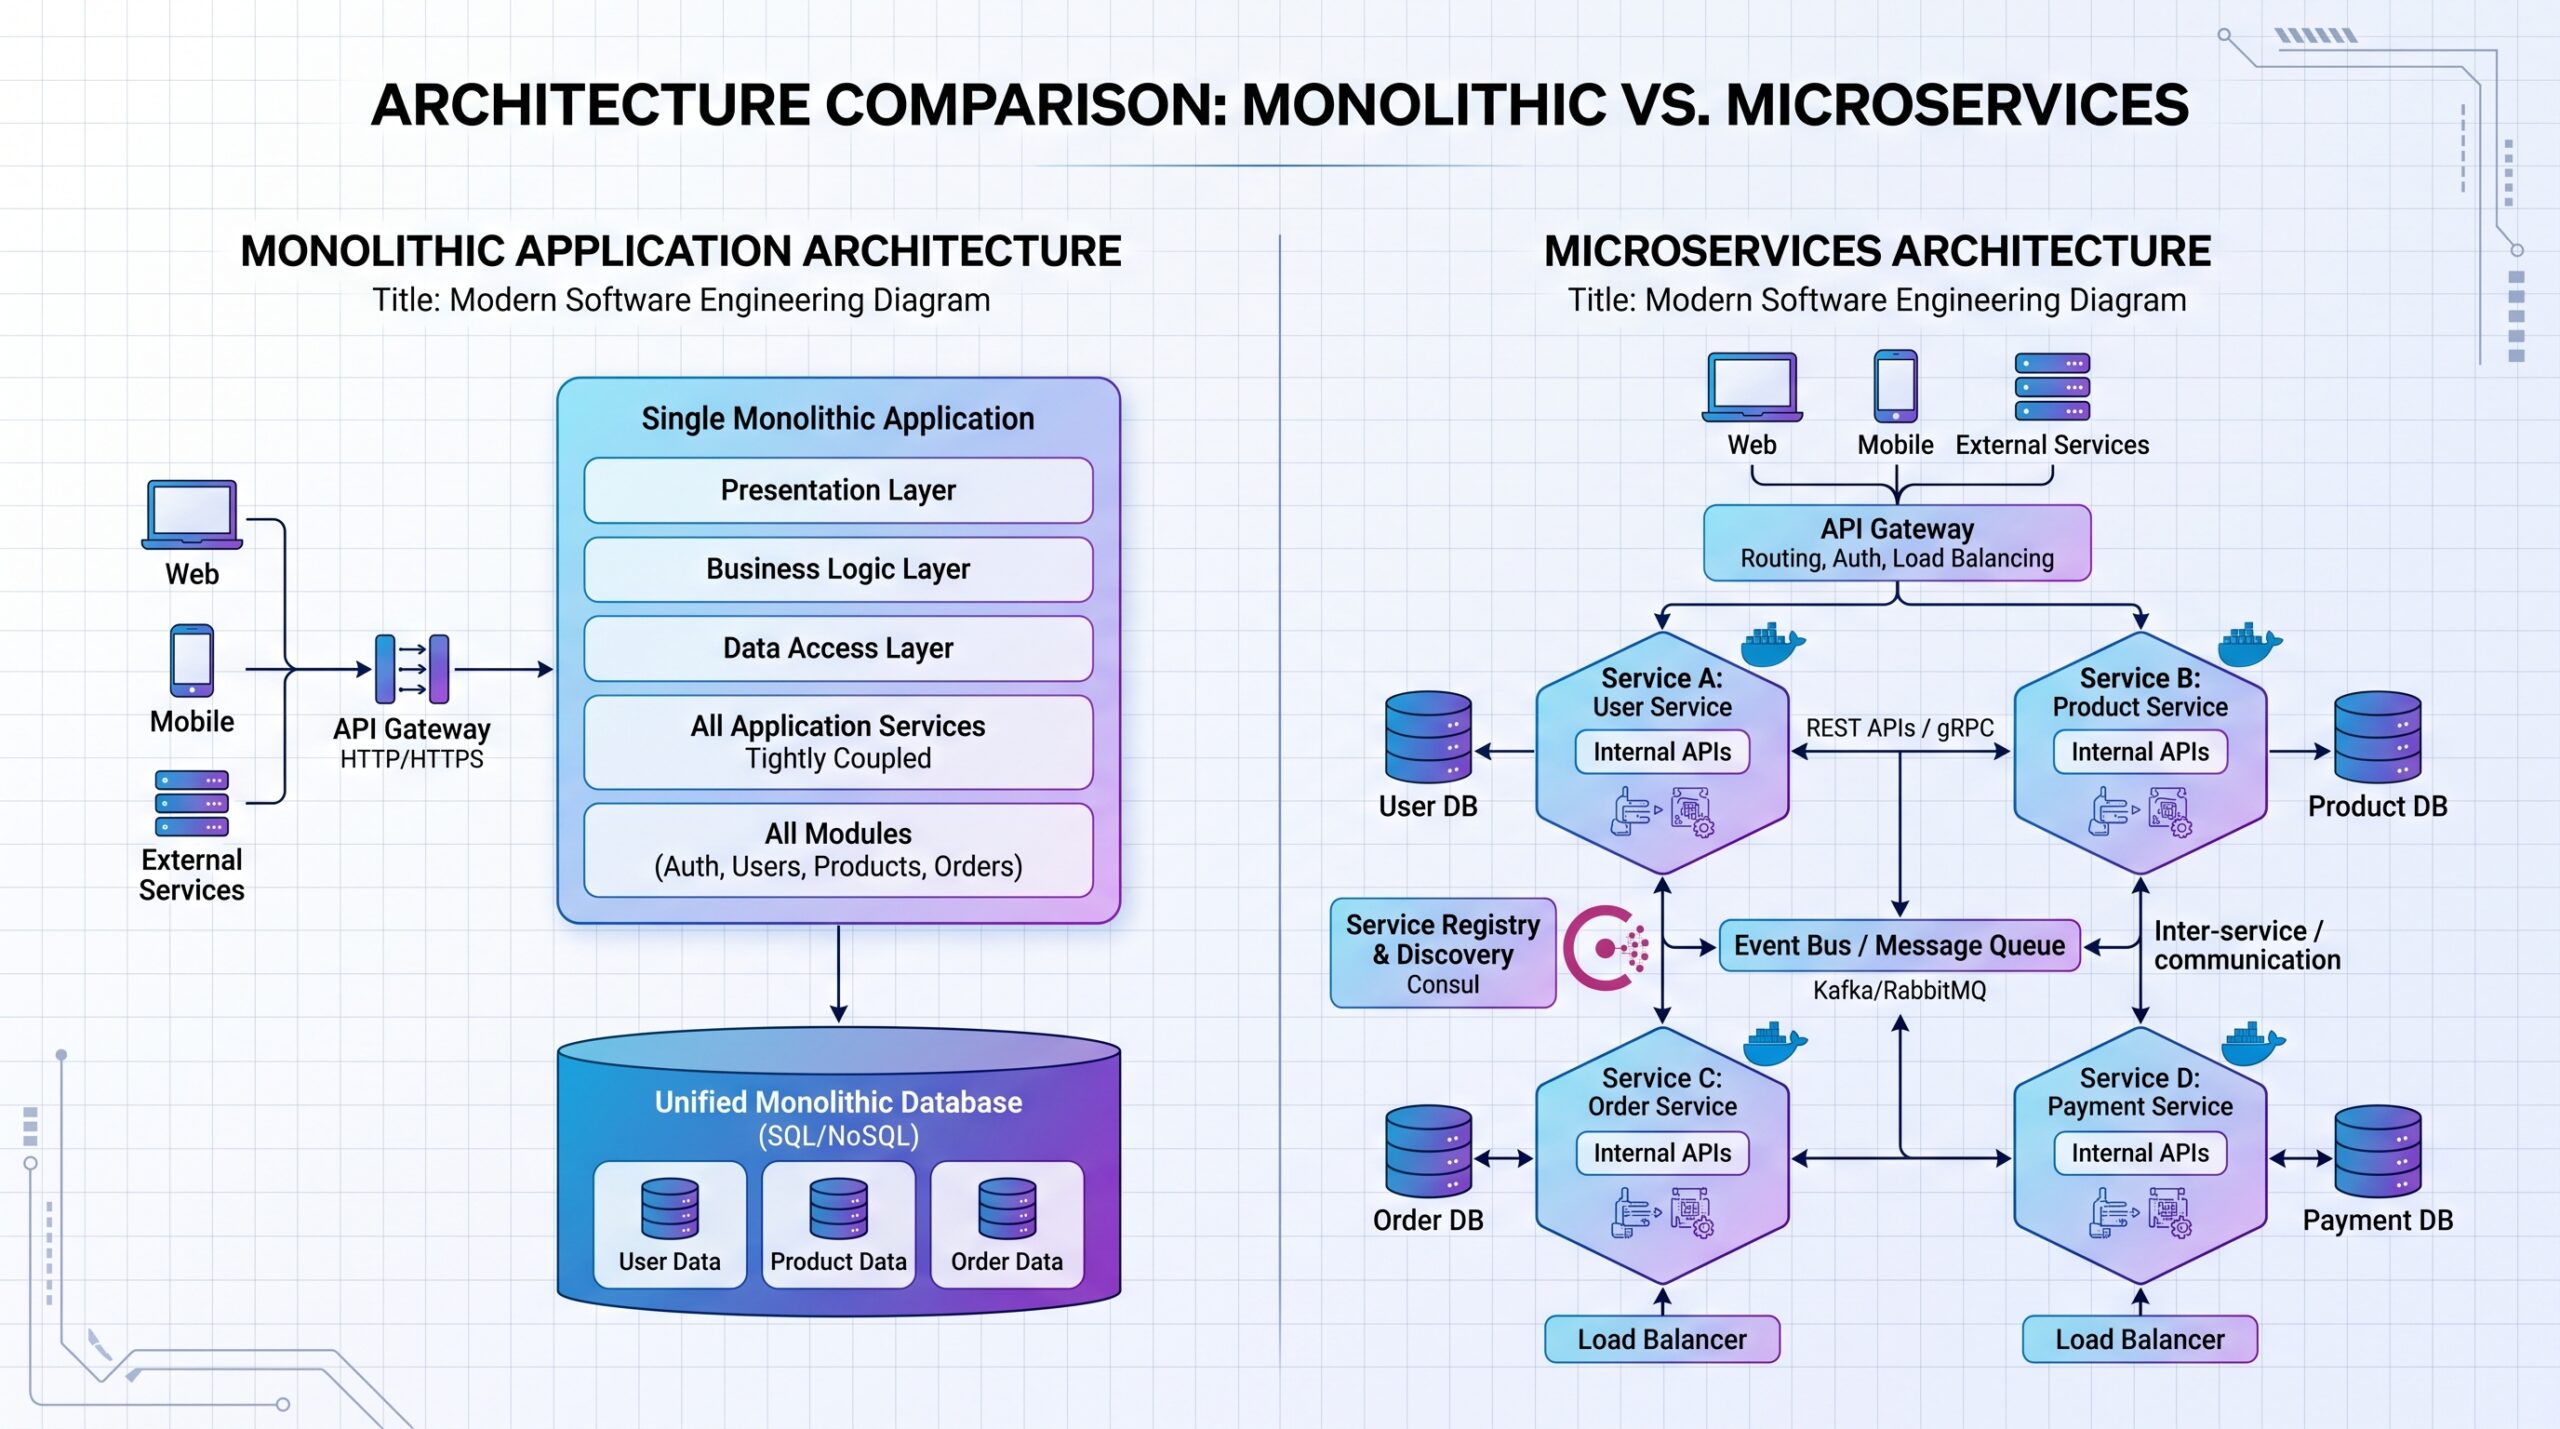
This is the most emotionally charged debate in software architecture, and it's often had backwards. Teams don't choose microservices because their system requires it — they choose it because it sounds modern, or because Netflix does it. That's a mistake that has buried numerous well-funded startups.
Monolithic Architecture
A monolith is a single deployable unit where all features share the same process and codebase. This is not a dirty word. A well-structured monolith with clean module boundaries is easier to develop, test, debug, and deploy than a distributed system.
- Advantages: Simple debugging (one log file, one stack trace), easy refactoring across features, fast local development, zero network latency between components.
- Disadvantages: Deployments update everything at once, horizontal scaling applies to the whole thing, one team's bad code can destabilize the entire system.
- Ideal for: Teams under ~50 engineers, early-stage products, systems under 100K daily active users.
Microservices Architecture
Microservices split your application into small, independently deployable services that communicate over the network (HTTP/REST, gRPC, or message queues). The promise is independent scaling, independent deployability, and team autonomy.
- Advantages: Scale individual services independently, deploy them separately, write them in different languages.
- Disadvantages: Every function call becomes a network request. You now have distributed systems problems: partial failure, network timeouts, service discovery, distributed tracing, eventual consistency.
When NOT to Use Microservices
If your entire engineering team can still fit in one Zoom call, you probably don't need microservices. The real cost of microservices isn't the infrastructure — it's the operational overhead. You need sophisticated observability, automated deployment pipelines, service meshes, and engineers who understand distributed systems. None of that comes for free.
When Migration Makes Sense
Migrate when: a single module is causing repeated production incidents, independent teams are stepping on each other's deployments, or one component needs a fundamentally different scaling strategy from the rest of the app. These are real signals. Extract the problematic service first — not everything at once.
Section 7: Infrastructure Considerations
Cloud Platforms
| Provider | Strengths | Best For | Managed Services |
|---|---|---|---|
| AWS | Broadest service catalog, mature ecosystem, global reach | Most use cases; best tooling for startups | RDS, ElastiCache, EKS, SQS, CloudFront |
| Google Cloud | Kubernetes-native, BigQuery, ML tooling, global fiber network | Data-intensive apps, ML/AI workloads | GKE, Cloud SQL, Memorystore, Pub/Sub |
| Azure | Deep Microsoft/enterprise integration | Enterprises already in the Microsoft ecosystem | AKS, Cosmos DB, Azure Cache, Service Bus |
Containers and Docker
Docker solves the "it works on my machine" problem by packaging your application with all its dependencies into a portable image. Every environment — development, staging, production — runs an identical container. Immutable deployments mean you never patch a running server; you replace it with a new image. This eliminates entire classes of configuration-drift bugs.
FROM node:20-alpine AS builder
WORKDIR /app
COPY package*.json ./
RUN npm ci --only=production

FROM node:20-alpine
WORKDIR /app
COPY --from=builder /app/node_modules ./node_modules
COPY . .

# Run as non-root user for security
RUN addgroup -S app && adduser -S app -G app
USER app

EXPOSE 3000
CMD ["node", "server.js"]
Kubernetes — The Orchestration Layer
Kubernetes is what you use to run Docker containers at scale. It handles scheduling (which container runs on which server), auto-healing (restarting crashed containers), service discovery (containers finding each other), and Horizontal Pod Autoscaling (adding more containers when CPU or memory spikes).
apiVersion: autoscaling/v2
kind: HorizontalPodAutoscaler
metadata:
  name: api-server-hpa
spec:
  scaleTargetRef:
    apiVersion: apps/v1
    kind: Deployment
    name: api-server
  minReplicas: 3
  maxReplicas: 50
  metrics:
    - type: Resource
      resource:
        name: cpu
        target:
          type: Utilization
          averageUtilization: 60    # scale out when CPU > 60%
    - type: Resource
      resource:
        name: memory
        target:
          type: Utilization
          averageUtilization: 70
CDN — Content Delivery Networks
A CDN places cached copies of your static content (images, JS, CSS, and even dynamic API responses) at edge servers around the world. A user in Lagos loading your app doesn't wait for a round-trip to a server in Virginia — they get a response from a node in Lagos or nearby.
At 100K users, a CDN typically reduces your origin server load by 60–80% and cuts global median latency in half. The three major options are Cloudflare (excellent DDoS protection, generous free tier), Fastly (real-time purging, great for dynamic content), and Akamai (largest network, enterprise-grade SLAs).
Section 8: Monitoring and Observability
You cannot scale what you cannot measure. At 100 users, you know something is wrong when someone emails you. At 100,000 users, you need to know something is degrading before any user notices. Observability isn't optional at scale — it's the foundational layer everything else rests on.
The Four Golden Signals
Google's Site Reliability Engineering book defines four signals that together give you a complete picture of system health:
- Latency — how long requests take. Track p50, p95, p99 percentiles separately. An average can hide that 1% of your users are having a terrible time.
- Traffic — how many requests per second your system is handling. Know your baseline; spikes stand out immediately.
- Errors — the rate of failed requests (HTTP 5xx, timeout, exception). Any sustained error rate above 0.1% deserves investigation.
- Saturation — how "full" your resources are. CPU, memory, disk I/O, connection pool utilization. Systems degrade before they fail.
Tooling Stack
| Tool | Purpose | When to Use |
|---|---|---|
| Prometheus | Metrics collection and alerting | The standard for Kubernetes environments |
| Grafana | Dashboards and visualization | Pairs with Prometheus; excellent free tier |
| ELK Stack | Log aggregation and search | When you need full-text search over logs |
| OpenTelemetry | Distributed tracing + unified instrumentation | Microservices environments; vendor-neutral |
| Datadog | All-in-one APM, logs, metrics | Teams that want managed observability |
import logging
import json
import uuid
from datetime import datetime

class StructuredLogger:
    def __init__(self, service_name: str):
        self.service = service_name

    def log(self, level: str, message: str, **context):
        entry = {
            "timestamp": datetime.utcnow().isoformat() + "Z",
            "level": level,
            "service": self.service,
            "message": message,
            "trace_id": context.pop("trace_id", str(uuid.uuid4())),
            **context
        }
        print(json.dumps(entry))  # ship to ELK / CloudWatch / Datadog

logger = StructuredLogger("api-server")

# Usage
logger.log("INFO", "Request completed",
           method="GET",
           path="/api/users/42",
           status=200,
           latency_ms=14,
           user_id=42,
           trace_id="abc-123")
Section 9: Real-World Case Study — SaaSly's Journey
Let's trace a fictional but realistic SaaS startup — SaaSly, a project management tool — through four years of growth.
1
100 Users — The Happy Single Server
Single $40/mo DigitalOcean droplet. PostgreSQL and Node.js API on the same machine. No cache, no load balancer, no monitoring. Deploys by SSH-ing in and running git pull. It works because the load is trivial.
- Stack: Node.js + PostgreSQL + Nginx on one VM
- Deploy: manual SSH
- Monitoring: none (log into server and run
top)
6
10,000 Users — The First Crisis
A Product Hunt launch brings 800 concurrent users. The server buckles. Database queries that took 12ms now take 4 seconds. The team spends a weekend fire-fighting. They find three queries doing full table scans on a 2M-row table.
- Fix: Add indexes on the three slow queries. Response times drop 95%.
- Fix: Move database to managed RDS instance with automated backups.
- Fix: Add Datadog — first time they can actually see what's happening.
- Lesson: You can't fix what you can't see.
12
100,000 Users — Architectural Debt Arrives
The database is now the bottleneck even after indexing. Expensive dashboard queries hit the primary on every page load. Email sending is synchronous — slow SMTP calls are blocking API responses.
- Fix: Redis cache for dashboard data (TTL: 60s). DB load drops 70%.
- Fix: Bull queue for email sending. API response time cut in half.
- Fix: AWS ALB + two additional app servers. Zero-downtime deploys.
- Fix: CloudFront CDN for all static assets.
- Lesson: Async everything that doesn't need to be synchronous.
2
1 Million Users — The Distributed System
The monolith is now running across 12 app servers behind an ALB. The database primary can't keep up with writes — specifically, the activity log table which grows by 5M rows per day. Two read replicas handle all reporting queries.
- Fix: Partition the activity_logs table by month. Archive old partitions to S3.
- Fix: Extract the notification system into a separate service — it was causing memory spikes in the main app.
- Fix: Kubernetes on EKS for the main API. Auto-scaling from 8 to 30 pods during business hours.
- Fix: Multi-region: US-East primary, EU-West replica for GDPR compliance.
- Lesson: Extract services when a specific component is causing production pain — not before.
Section 10: Common Scaling Mistakes
EXPLAIN ANALYZE before provisioning infrastructure.pg_stat_statements tracking from day one.Best Practices Checklist
- Add monitoring (Datadog, Prometheus) before scaling anything
- Run EXPLAIN ANALYZE on all queries accessing tables over 100K rows
- Add database indexes for all columns used in WHERE, JOIN, and ORDER BY clauses
- Move your database to its own server/managed instance early
- Configure structured JSON logging from day one
- Set up Redis for session storage before your first horizontal scaling event
- Use a CDN for all static assets (images, JS, CSS)
- Configure a load balancer with health checks and graceful failover
- Make application servers stateless — no local file storage, no in-memory session state
- Implement read replicas before the primary database becomes the bottleneck
- Async all non-critical operations — email, push notifications, analytics events
- Set up automated database backups with tested restore procedures
- Run load tests (k6, Locust) before known traffic events
- Alert on p99 latency, not just averages
- Configure auto-scaling policies with sensible min/max bounds
- Document your runbooks for common incidents before you need them
- Implement circuit breakers for all external service calls
- Use infrastructure-as-code (Terraform, Pulumi) for all production resources
- Set cache TTLs on every cached value — no indefinite caching
- Set up a staging environment that mirrors production architecture before going to 100K users
- Configure rate limiting on all public API endpoints
- Test your disaster recovery procedures on a schedule
Frequently Asked Questions
Conclusion
Key Lessons From 100 to 1 Million Users
- Start simple. A well-built monolith on a single server is the correct starting point. Complexity should be earned, not designed.
- Measure first, always. You cannot optimize what you can't observe. Add monitoring before you add infrastructure.
- The database is almost always the first bottleneck. Indexing and caching are the highest-ROI optimizations at every stage of growth.
- Caching is the fastest win on the board. A well-placed Redis cache frequently eliminates 80% of database load with a day's engineering effort.
- Scale incrementally. Add a load balancer, then add app servers. Add a read replica, then add sharding. Don't skip stages.
- Stateless applications unlock horizontal scale. If any server can handle any request, you can add and remove servers freely. Externalize all state to Redis and your database.
- Reliability must be built in, not bolted on. Health checks, circuit breakers, graceful degradation, and chaos testing should be part of your architecture — not afterthoughts.
Immediate next steps: If your application is in production right now, run EXPLAIN ANALYZE on your five most frequent database queries. Add Prometheus or Datadog if you don't have it. Then check whether your sessions are stored in Redis or in application memory — that single change will unlock your next stage of growth.
The path from 100 users to 1 million isn't a single architectural leap. It's a series of measured, targeted improvements made at exactly the right moment. Know the path, measure constantly, and you'll get there without the 3am disaster recovery sessions that define so many viral launch stories.
Similar Posts
Designing a Payment System: Challenges and Solutions
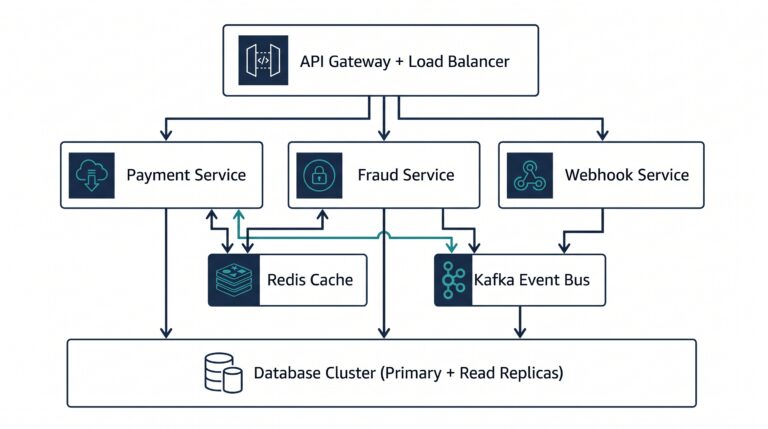
ByFavourDesigning a Payment System: Challenges and Solutions FinTech Engineering — System Design Deep Dive System Design FinTech 15 min read A customer clicks “Pay Now.” Within two seconds, money moves between banks, a fraud engine evaluates hundreds of signals, databases record the transaction, and a notification lands in an inbox. The customer sees a spinner….
How to Design a REST API That Doesn’t Become a Nightmare Later
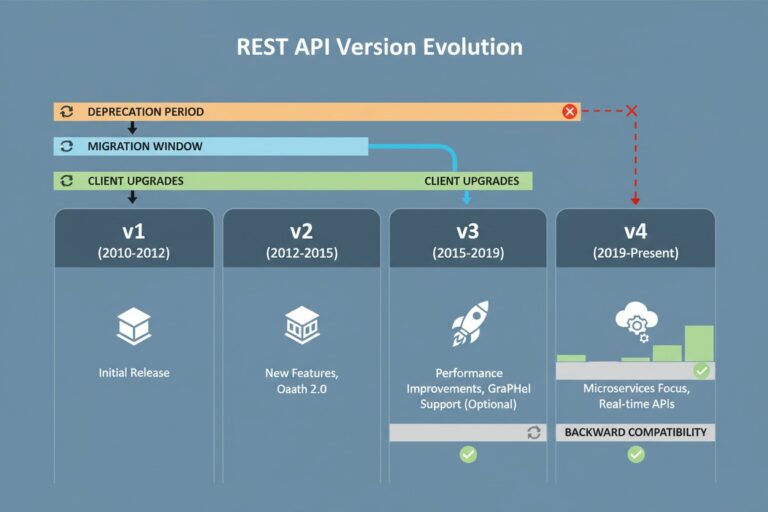
ByFavourA practical guide for backend developers, full-stack engineers, and software architects who want to build APIs that age well. Introduction Imagine this: a small startup ships their MVP in six weeks. The backend is a Node.js REST API slapped together under pressure. Endpoints are inconsistent — some use /getUser, others use /users/profile. Fields are named…