Debugging Memory Leaks: A Step-by-Step Guide
Engineering deep dive
Few software bugs are as quietly destructive as the memory leak. They don't crash your service immediately. They don't throw stack traces. They simply grow slowly, steadily like a balloon being inflated in a room with no windows, until something eventually gives way.
I've spent years on-call for production systems, and memory leaks are the class of bugs I dread most. Not because they're intellectually hard to understand, but because they're genuinely difficult to find. The bug exists in code you may have shipped weeks ago, in a dependency you didn't write, in an architectural decision that seemed harmless at the time.
Imagine your API service is humming along on Monday morning. 500 MB of RAM, response times under 50ms. By Wednesday afternoon, it's using 3 GB. By Friday night, it's at 8 GB and then your Kubernetes pod crashes, taking down a chunk of production traffic with it. On-call engineers frantically restart the pods. Everything recovers… until the cycle repeats next week.
The fix, when you eventually find it, will be three lines of code. But finding those three lines will take two engineers, four days, and a lot of cold coffee.
This guide is a field manual for exactly that investigation. We'll cover what memory leaks are, why they happen in every language (yes, including garbage-collected ones), how to diagnose them systematically, and how to prevent them from reaching production in the first place.
Section 1: What Is a Memory Leak?
A memory leak occurs when a program allocates memory that it no longer needs but never frees. The allocated block sits in the heap, invisible and inert, occupying space that could have been reclaimed for other purposes. Over time, leaked allocations accumulate until the process exhausts available memory.
This sounds simple. But here's the nuance that trips most developers up: a memory leak is not simply "memory that was allocated." It's memory that is no longer useful to the program but is still referenced. That distinction matters enormously, especially in garbage-collected languages.
The difference between normal usage and a leak
Normal memory usage follows a pattern: allocate, use, release. A cache that holds 1,000 items and stays at 1,000 items is not a leak — it's a bounded allocation. A cache that holds 1,000 items today, 10,000 items tomorrow, and 100,000 items next week is leaking. The size is unbounded and growing.
Why garbage-collected languages still leak
This is the most common misconception I encounter. Developers moving from C/C++ to Python, Java, or JavaScript assume that garbage collection eliminates memory leaks. It doesn't. GC only reclaims memory that has no live references. If your code holds a reference to an object — even unintentionally the garbage collector cannot touch it. The reference is a lease on that memory, valid indefinitely.
| Language | Memory model | Common leak cause |
|---|---|---|
| C | Manual malloc/free | Forgetting to call free() |
| C++ | Manual + RAII | Raw pointers without destructors |
| Java | GC (tracing) | Static collections, class loader leaks |
| C# | GC (tracing) | Event handlers, unmanaged resources |
| JavaScript | GC (tracing) | Closures, DOM listeners, global state |
| Python | Reference counting + cyclic GC | Circular references, global caches |
| Go | GC (tracing) | Goroutine leaks, long-lived slices |
Stack vs. heap: a quick primer
Understanding the two memory regions clarifies where leaks actually live:
The stack holds local variables and function call frames. It's managed automatically when a function returns, its stack frame is popped. You almost never leak from the stack (stack overflow is a different problem).
The heap is where dynamic allocations live. It's where objects, arrays, and buffers are created at runtime. This is where every memory leak happens. When an object is created with new, malloc, or an object literal, it goes on the heap. If nothing frees it and the GC can't collect it (because something still holds a reference), it stays there.
Stack memory is managed automatically. Heap memory can accumulate leaked objects when references are inadvertently held.
Section 2: How Memory Leaks Happen
Memory leaks have a surprisingly small set of root causes. Understanding these patterns means you can recognize them in code review before they ever reach production.
1. Forgotten References
The simplest leak: you store an object somewhere, forget it's there, and never clean it up. The object sits in memory indefinitely, held alive by a reference you've long forgotten about.
// BAD: requestLog grows forever. Every request adds an entry, nothing removes them.
const requestLog = [];

app.use((req, res, next) => {
  requestLog.push({
    url: req.url,
    headers: req.headers,   // large objects!
    body: req.body,
    timestamp: new Date()
  });
  next();
});// BAD: Static list retains all Widgets ever created
public class WidgetFactory {
private static final List<Widget> allWidgets = new ArrayList<>();
public static Widget create() {
Widget w = new Widget();
allWidgets.add(w); // never removed!
return w;
}
}2. Global Variables
Global state in any language is a memory management hazard. In JavaScript especially, globals have the lifetime of the browser tab or Node.js process — that's forever from the GC's perspective.
// BAD: Every call to processUser appends to a module-level array
const userSessions = {};

function processUser(userId, sessionData) {
  userSessions[userId] = sessionData;  // entries are never evicted
  // ... do work ...
}
3. Event Listener Leaks
This is the most common memory leak in frontend applications, and it's particularly insidious in React because it hides inside component lifecycle methods.
// BAD: Each time init() is called, a new listener is added.
// Old listeners are never removed, even if the element is gone.
function init() {
  const button = document.getElementById('submit');
  button.addEventListener('click', handleSubmit);
}

// GOOD: Store the reference and clean up on teardown
let cleanup;
function init() {
  const button = document.getElementById('submit');
  button.addEventListener('click', handleSubmit);
  cleanup = () => button.removeEventListener('click', handleSubmit);
}// BAD: WebSocket listener survives component unmount
function DataFeed() {
useEffect(() => {
ws.on('message', handleMessage);
// no cleanup!
}, []);
}
// GOOD: Return a cleanup function from useEffect
function DataFeed() {
useEffect(() => {
ws.on('message', handleMessage);
return () => ws.off('message', handleMessage);
}, []);
}4. Timers and Intervals
A setInterval() that's never cleared is a form of memory leak. The callback closure keeps all its captured variables alive, and if the interval is long-running, those objects never get collected.
// BAD: interval captures 'data' (could be huge), never cleared
function startPolling(data) {
  setInterval(() => {
    process(data);  // 'data' is kept alive by this closure
  }, 5000);
}

// GOOD: Store the ID and clear when done
function startPolling(data) {
  const id = setInterval(() => process(data), 5000);
  return () => clearInterval(id);
}
5. Cache Growth Without Bounds
Caches are a productive source of memory leaks. An in-memory cache with no eviction policy is an append-only data structure. Every new key you add stays forever.
// BAD: This cache grows indefinitely
const cache = {};

async function getUserData(userId) {
  if (cache[userId]) return cache[userId];
  const data = await db.query(userId);
  cache[userId] = data;  // stored, never evicted
  return data;
}

// GOOD: Use an LRU cache with a maximum size
const LRU = require('lru-cache');
const cache = new LRU({ max: 1000, ttl: 1000 * 60 * 60 }); // 1h TTL
6. Circular References
Object A holds a reference to Object B; Object B holds a reference back to Object A. In pure reference-counting systems (older Python, older IE), this was catastrophic — the counts never hit zero. Modern tracing GCs handle circular references correctly, but they can still cause confusion when combined with WeakMaps or external references.
class Parent {
  constructor() { this.child = new Child(this); }
}
class Child {
  constructor(parent) { this.parent = parent; }
}
// Modern JS GC handles this fine IF no other references exist.
// But if 'parent' is held in a global or a closure, neither is collected.
7. Resource Leaks
File handles, database connections, and network sockets all consume system resources backed by memory. Failing to close them causes both functional failures (too many open file descriptors) and memory growth.
# BAD: File handle leaks if an exception is thrown
def read_file(path):
    f = open(path)
    data = f.read()
    # if anything throws here, f is never closed
    return data

# GOOD: Context managers guarantee cleanup
def read_file(path):
    with open(path) as f:
        return f.read()
Section 3: Symptoms of a Memory Leak in Production
Memory leaks rarely announce themselves. They disguise themselves as performance problems, infrastructure issues, or simple bad luck. Here's what to look for.
Gradually increasing RAM usage
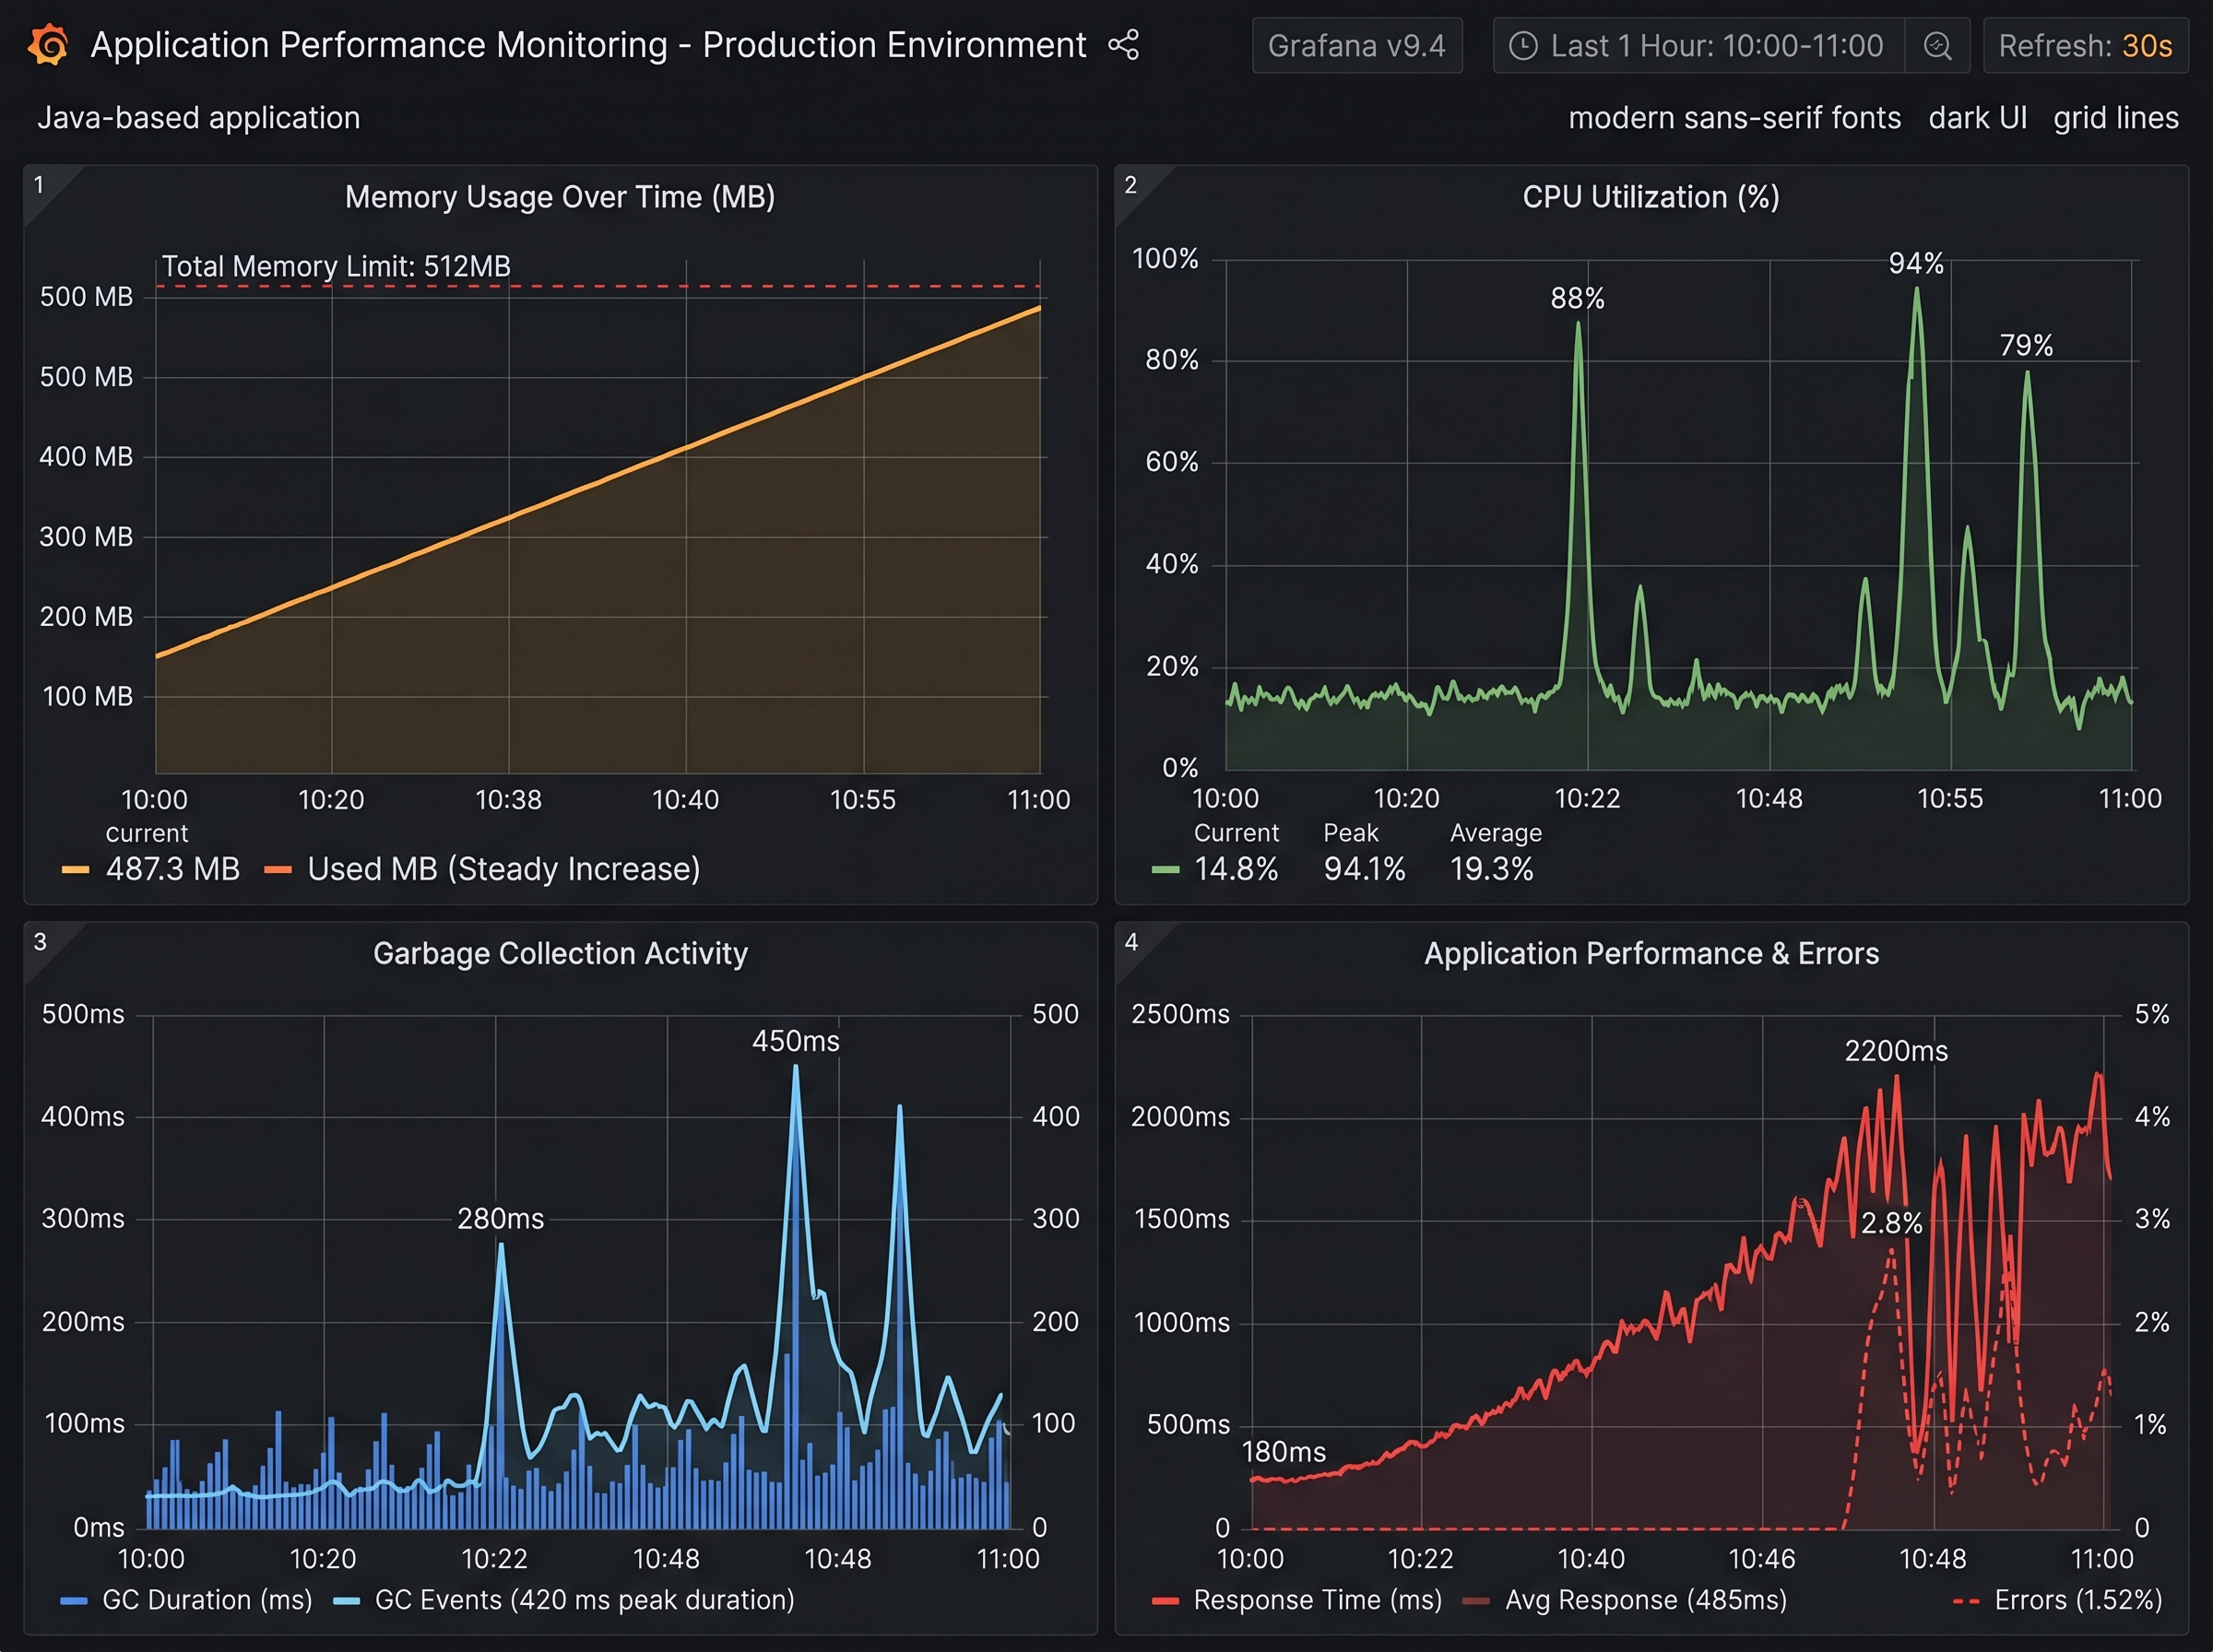
This is the canonical symptom. If you graph your process's RSS (Resident Set Size) or heap usage over time and it's a slope rather than a flat line with noise, you have a leak. The slope may be gentle — 10 MB/hour — but it's unambiguous. Normal programs have a steady-state memory footprint.
Slower response times
As heap usage grows, the garbage collector has more work to do. GC pauses grow longer. These pauses block your event loop (Node.js) or stop-the-world (JVM, .NET), causing latency spikes that are otherwise inexplicable.
Frequent garbage collection
A healthy process collects garbage infrequently. A leaking process triggers GC constantly trying to free space, spending more and more CPU on collection rather than actual work. You'll see this as elevated CPU usage even during low-traffic periods.
Application crashes and OOM kills
The terminal symptom. Linux's Out-of-Memory (OOM) killer will terminate processes that exceed available memory. Kubernetes will restart pods. Docker containers will be OOM-killed. If your pods restart on a schedule — daily, weekly — with no other explanation, you're almost certainly looking at a slow leak.
Section 4: Memory Profiling Concepts
Before you can fix a leak, you need to understand what profilers actually tell you.
Heap dumps and snapshots
A heap snapshot is a point-in-time photograph of everything in your process's memory: every object, its size, and every reference between objects. When you take two snapshots — one before a suspected leak scenario and one after — you can diff them to see exactly what grew.
Retained size vs. shallow size
Two metrics you'll see in every profiler:
Shallow size is the memory an object itself occupies just the object's own fields, not anything it points to. A JavaScript array of 1,000 pointers has a shallow size of ~8,000 bytes (the pointer slots), not the memory of the objects those pointers reference.
Retained size is the total memory that would be freed if this object were deleted, it includes the transitive closure of everything it holds. This is the number that matters for memory leak analysis. A small object with a huge retained size is often the "anchor" holding a large object graph alive.
The dominator tree
The dominator tree is the most powerful tool in a heap profiler. It answers: "If I delete this one object, how much memory would be freed?" Objects near the root of the dominator tree are the primary leak anchors — fixing the reference to one of them can free megabytes of downstream memory.
The dominator tree reveals that GlobalCache is retaining 847 MB through two child object graphs. Fixing the leak at the root frees all downstream memory.
Section 5: Tools for Finding Memory Leaks
JavaScript / Node.js
Chrome DevTools is the gold standard for browser-side leak detection. The Memory tab offers three modes: heap snapshot (point-in-time), allocation instrumentation on timeline (records allocations over time), and allocation sampling (low-overhead continuous profiling).
For Node.js, use --inspect to connect Chrome DevTools to your server process, or use the v8 module directly to capture heap snapshots programmatically:
const v8 = require('v8');
const fs = require('fs');

function takeHeapSnapshot(label) {
  const filename = `heap-${label}-${Date.now()}.heapsnapshot`;
  const ws = fs.createWriteStream(filename);
  const snapshot = v8.writeHeapSnapshot();
  console.log(`Snapshot written to ${snapshot}`);
}

// Trigger via: process.kill(process.pid, 'SIGUSR2')
// or expose an admin endpointChrome DevTools
Heap snapshots, allocation timeline, comparison view
Clinic.js
Beautiful heap flame graphs and memory profiling suite
Eclipse MAT
Dominator tree, OQL query, leak suspect analysis
VisualVM
Live heap monitoring, thread analysis, class histograms
tracemalloc
Built-in stdlib tracing for allocation sources
objgraph
Find which object types are growing, draw reference graphs
pprof
Built-in profiler, heap profile, goroutine analysis
dotMemory
JetBrains profiler with automatic leak detection
htop / top
Quick process memory sanity check (RSS, VSZ columns)
vmstat / free
System-wide memory pressure and swap usage
Java deep dive
For JVM applications, the workflow is: generate a heap dump with jmap, then analyze it with Eclipse Memory Analyzer (MAT). The killer feature of MAT is the "Leak Suspects" report — it automatically identifies objects that are retaining unexpectedly large amounts of memory and traces their reference chains back to GC roots.
# Get the PID
jps -l

# Dump the heap (live=true filters out unreachable objects)
jmap -dump:format=b,live=true,file=heap.hprof <PID>

# Then open heap.hprof in Eclipse MAT or VisualVM
Python deep dive
tracemalloc is built into Python 3.4+ and is the cleanest way to track allocation sources:
import tracemalloc
import linecache

tracemalloc.start(25)  # track 25-frame deep call stacks

# ... run the code you suspect is leaking ...
run_workload()

snapshot = tracemalloc.take_snapshot()
top_stats = snapshot.statistics('lineno')

for stat in top_stats[:10]:
    print(stat)
For visual object graph inspection, objgraph can show you which types are accumulating and draw reference chains directly to your terminal:
import objgraph

# Show the 10 most common object types
objgraph.show_most_common_types(limit=10)

# Find what's referencing a specific object
objgraph.show_backrefs(
    objgraph.by_type('MyLeakingClass')[0],
    max_depth=3
)
Go deep dive
Go's pprof is beautifully integrated. You can expose a profiling endpoint in any HTTP server with two lines:
import _ "net/http/pprof"
import "net/http"

go http.ListenAndServe(":6060", nil)

// Then capture and analyze a heap profile:
// go tool pprof http://localhost:6060/debug/pprof/heap
// (interactive prompt — type 'top', 'web', or 'list funcName')# Capture heap profile
curl -s http://localhost:6060/debug/pprof/heap > heap.prof
# Analyze in browser (flame graph)
go tool pprof -http=:8080 heap.prof
# Show top memory consumers in terminal
go tool pprof heap.prof
(pprof) top10Section 6: The Real Debugging Workflow
Let's walk through a real incident. An API service starts its week at 500 MB RAM and climbs to 8 GB over four days before crashing. Here's the investigation, step by step.
Confirm the leak exists
Don't assume. First, check your monitoring. You want to see the shape of memory usage over time. A sawtooth pattern (up, GC drops it back down, up again) is normal. A consistent upward trend with no return to baseline is a leak.
Useful commands to check immediately:
# Check process memory every 5 seconds
watch -n 5 'ps aux --sort=-%mem | head -5'

# Check RSS of a specific PID
cat /proc/<PID>/status | grep -E 'VmRSS|VmPeak'

# System-level view
free -h && vmstat 5 3Reproduce the problem
You cannot fix what you cannot reproduce. In production, memory may grow slowly over hours. In a test environment, you need to accelerate this. Load testing is your friend here.
# Hammer the suspected endpoint for 60 seconds
npx autocannon -c 50 -d 60 http://localhost:3000/api/users

# Watch memory during the test in another terminal
watch -n 2 'node -e "const m=process.memoryUsage(); \
  console.log(\"Heap:\", Math.round(m.heapUsed/1e6), \"MB\")"'
If memory grows significantly during 60 seconds of load testing, you've confirmed the leak is traffic-driven and reproducible. Now you can debug without touching production.
Capture heap snapshots
Take your first snapshot before any load. Let the process warm up (some memory growth is legitimate initialization — give it a few minutes). Then take the baseline snapshot.
Run your load test or the suspected operation. Take a second snapshot.
global.gc() (requires --expose-gc flag). In JVM: System.gc() before jmap. This ensures you're seeing only genuinely retained objects.
Compare snapshots
Open both snapshots in your profiler and switch to "Comparison" view. Filter by "Objects allocated between snapshots" and sort by retained size (descending). The objects at the top are your prime suspects.
In Chrome DevTools: load snapshot 1, load snapshot 2, select snapshot 2, and change the dropdown from "Summary" to "Comparison." You'll see a delta of object counts and sizes.
What you're looking for is a class or type that has an unexpectedly large delta count — especially if it's a class you own (not a built-in). Something like UserSession ×4,200 (△+4,182) is a massive red flag.
Identify the root cause
In our scenario, the heap comparison shows that RequestContext objects are growing without bound. Drilling into the retaining path reveals they're being held by a module-level Map called activeRequests.
Looking at the code:
// This file was in request-tracker.js
const activeRequests = new Map();

function trackRequest(req) {
  const id = generateId();
  activeRequests.set(id, {
    url: req.url,
    startTime: Date.now(),
    headers: req.headers,  // includes auth tokens, large payloads
    context: req.context   // references to upstream clients
  });
  req.requestId = id;
  // BUG: trackRequest is called on every request.
  // removeRequest was meant to be called on response, but...
}

function removeRequest(requestId) {
  activeRequests.delete(requestId);
}

// In app.js, this hook was never actually wired up:
// app.use((req, res, next) => { res.on('finish', () => removeRequest(req.requestId)); next(); });Implement the fix
The fix in this case involves two parts: correctly wiring the cleanup, and adding a safety net in case it fails again.
const activeRequests = new Map();

function trackRequest(req, res) {
  const id = generateId();
  activeRequests.set(id, {
    url: req.url,
    startTime: Date.now(),
    // Don't store large blobs — store only what you need
    method: req.method
  });
  req.requestId = id;

  // FIX: Wire cleanup directly here, so it's impossible to forget
  res.on('finish', () => activeRequests.delete(id));
  res.on('close',  () => activeRequests.delete(id));  // for aborted requests
}

// Safety net: evict anything older than 5 minutes regardless
setInterval(() => {
  const cutoff = Date.now() - 5 * 60 * 1000;
  for (const [id, entry] of activeRequests) {
    if (entry.startTime < cutoff) activeRequests.delete(id);
  }
}, 60_000);
Verify resolution
Deploy the fix to a staging environment. Run the same load test you used to reproduce the leak. Watch memory. You should see it rise modestly during peak load and return to baseline when load drops — the sawtooth of a healthy process.
Left: memory leak growing until OOM crash. Right: healthy process with stable memory and normal GC sawtooth pattern after fix.
Once verified in staging, ship to production. Monitor for 24–48 hours to confirm the upward trend has stopped. Add an alerting rule for heap usage exceeding a threshold, so this class of problem triggers a proactive investigation next time rather than a 3am page.
Section 7: Case Studies
Map. Cache keys were full URLs including query strings. With 200+ unique user IDs as query params, the cache grew by ~50 KB per unique request, never evicting. After one week, the cache held 4+ GB of response data.Map { size: 87,000 } with String objects dominating retained size. The strings were JSON response payloads. Retaining path led back to the module-level cache variable.Map with lru-cache configured to hold a maximum of 500 entries with a 10-minute TTL. Memory dropped from 4 GB to ~80 MB and stayed flat. Cache hit rate remained healthy at ~65%.handlePriceUpdate were firing on each message, and the closures kept their entire component scope alive.useEffect hook: return () => ws.off('priceUpdate', handlePriceUpdate). Memory growth on navigation stopped immediately.useEffect that subscribes to an external event as a leak waiting to happen if it doesn't return a cleanup function. Audit all useEffect calls in your codebase as part of regular code review.ConcurrentHashMap keyed by session ID. The session expiration background thread was disabled in the production configuration by mistake (a property file change that was never reviewed). Sessions accumulated at ~200 KB each. After three weeks in production, 400,000+ sessions were resident in heap.SessionRegistry instance responsible for holding all sessions.Section 8: Prevention Strategies
Make resource cleanup structurally impossible to forget
The best fix for a memory leak is making it structurally impossible to write the leaking code in the first place. Use language features that enforce cleanup:
with db.connect() as conn, open(path) as f:
    data = f.read()
    conn.execute(query, data)
# both automatically closed here, even on exceptiontry (Connection conn = dataSource.getConnection();
PreparedStatement stmt = conn.prepareStatement(sql)) {
stmt.execute();
} // conn and stmt automatically closedBounded caches with eviction policies
Every cache should have a defined maximum size and a TTL. Choose an LRU (Least Recently Used) eviction policy for general-purpose caches — it naturally retains the most frequently needed entries while bounding memory usage.
When sizing your cache, think in terms of memory cost per entry, not just entry count. If each entry is 10 KB on average and you allow 10,000 entries, you're reserving 100 MB for the cache. Make that explicit in a comment so the next engineer understands the intentional memory footprint.
Memory leak tests in CI
The most underused prevention technique. Write tests that run a suspected-leaky operation N times and assert that memory usage after N iterations is not significantly higher than after the first few warm-up iterations:
test('processRequest does not leak memory', async () => {
  // Warm up
  for (let i = 0; i < 100; i++) await processRequest(mockReq());
  global.gc();

  const baseline = process.memoryUsage().heapUsed;

  // Run at scale
  for (let i = 0; i < 1000; i++) await processRequest(mockReq());
  global.gc();

  const after = process.memoryUsage().heapUsed;
  const growthMB = (after - baseline) / 1e6;

  // Allow up to 10 MB growth (legitimate caching, etc.)
  expect(growthMB).toBeLessThan(10);
});
Observability: alert before the crash
By the time a memory leak causes a production incident, it's too late for prevention — you're in incident mode. Set up proactive alerting that fires when heap usage or container memory crosses 70% of the limit. That gives you time to investigate and deploy a fix before the OOM kill.
A minimal Prometheus alert for container memory:
groups:
  - name: memory
    rules:
      - alert: HighHeapUsage
        expr: |
          container_memory_usage_bytes{container!=""} /
          container_spec_memory_limit_bytes{container!=""} > 0.70
        for: 15m
        labels:
          severity: warning
        annotations:
          summary: "{{ $labels.container }} using > 70% memory"
description: "Memory at {{ $value | humanizePercentage }}. Investigate for leak."A complete memory observability pipeline. When Prometheus detects anomalous heap growth, AlertManager fires — ideally triggering automated heap snapshot capture before manual investigation begins.
Section 9: The Memory Leak Debugging Checklist
Keep this checklist handy. Work through it in order — skipping steps wastes time.
- ✓Confirm the leak exists. Graph memory over time. Verify you're seeing monotonic growth, not normal GC sawtooth patterns.
- ✓Reproduce in a controlled environment. Use load testing or repeated operation execution. Never debug on production data if avoidable.
- ✓Gather baseline metrics. Record heap size, GC frequency, and response times before investigating. You need a before-state to compare against.
- ✓Capture a pre-load heap snapshot. Force GC first. This is your baseline.
- ✓Run the leaking workload. Apply load or repeat the operation. Let memory grow measurably.
- ✓Capture a post-load heap snapshot. Force GC again before capturing.
- ✓Compare snapshots. Filter by objects allocated between snapshots. Sort by retained size, descending.
- ✓Analyze retained objects. Focus on classes you own. Ignore noise from built-ins unless they're in the top 3.
- ✓Trace the reference chain. Follow retaining paths from the suspicious object back to a GC root. The root is where the leak is anchored.
- ✓Identify the specific code responsible. Find the allocating site and the location that should have freed the reference but didn't.
- ✓Implement the fix. Add a safety net (TTL, bounded size) in addition to the primary fix.
- ✓Verify in staging. Repeat the load test. Confirm the upward trend is gone.
- ✓Deploy and monitor production. Watch for 24–48 hours. Confirm stability at the previously growing metric.
- ✓Add a memory regression test. Write a test that would have caught this before it shipped.
- ✓Add a monitoring alert. Set a threshold alert so the next leak is caught proactively.
Common Mistakes Developers Make
GC removes unreachable objects. It has no opinion about reachable objects that are no longer useful. If your code holds a reference, GC won't touch it — ever.
Engineers routinely see gradual heap growth on their dashboards and dismiss it as "normal." It is rarely normal. A slope is a signal. Investigate it when it's a gentle slope, not after it becomes a cliff.
Total process memory includes many things. For leak investigation, focus on heap used (not heap total), and track object count by type in addition to raw bytes. A count that grows monotonically is diagnostic even if the total memory looks acceptable.
A single heap snapshot tells you what's in memory, not why it grew. The comparison between two snapshots — one taken before and one after load — is where the actual signal lives.
Restarting the pod on a schedule, increasing memory limits, or adding more nodes are all ways to delay the problem, not solve it. The underlying reference is still being held. Eventually you run out of runway.
Too early: jumping straight into profiling before confirming there's actually a leak (vs. normal growth). Too late: waiting until production is on fire before starting investigation, when you're under pressure and can't think clearly. Establish a process that catches leaks in staging or via monitoring before they become incidents.
Conclusion
Memory leak debugging is genuinely hard — but it's a disciplined investigation, not a guessing game. Every leak leaves a trail: growing object counts, expanding reference chains, a specific piece of code that holds a reference it should have released. The tools to follow that trail are excellent and getting better every year.
The most important shift in mindset is this: prevention and observability are just as important as the fix itself. A memory leak that's caught by a regression test in CI never reaches users. A leak that trips an alert at 70% memory utilization gets fixed with time to spare. A leak discovered during a 3am production incident is the same bug — but now you're debugging under pressure, with customers affected, and your team exhausted.
Engineers who develop strong instincts for memory management — who see a growing Map and immediately ask "what evicts from this?" — become dramatically more effective in production environments. The patterns are learnable. The tools are available. The only thing required is the discipline to actually profile rather than guess.
The takeaway
"Every memory leak leaves clues. The key is learning how to follow them."
Similar Posts

Understanding Race Conditions and Concurrency Problems: A Complete Developer’s Guide
ByFavourIntroduction: When $1,000 Becomes Negative Imagine you’re running a banking application. A customer has $1,000 in their account. Two withdrawal requests arrive at almost the same instant: Both requests check the balance. Both see $1,000. Both confirm sufficient funds. Both proceed. The account ends up at –$200. No fraud. No malicious code. Just two threads…