Why Your Website Loads Slowly and How to Improve Performance
Website speed is no longer just a technical concern, it is a business requirement.
In today’s digital landscape, users expect websites to load almost instantly. Studies consistently show that visitors abandon slow websites, search engines reward fast websites, and businesses lose revenue when pages take too long to load.
Whether you’re running a SaaS application, eCommerce platform, corporate website, content-driven blog, or startup MVP, performance directly impacts user experience, SEO rankings, conversions, customer retention, and operational costs.
Google’s Core Web Vitals have made performance optimization even more important. Search visibility increasingly depends on delivering fast, stable, and responsive experiences.
The good news is that most performance problems can be identified and fixed systematically.
This guide explains exactly why websites become slow and how to optimize every layer of your stack—from the browser to the database.
Understanding How Websites Load
Before optimizing performance, it’s important to understand what actually happens when someone visits your website.
A website request involves many steps.
Website Loading Process
- User enters URL
- DNS lookup occurs
- Browser establishes TCP connection
- TLS/SSL handshake begins
- Browser sends HTTP request
- Server processes request
- Database queries execute
- HTML is generated
- Assets are downloaded
- Browser renders content

DNS Lookup
DNS (Domain Name System) translates a domain name into an IP address.
For example:
example.com → 192.168.1.1
Without DNS resolution, browsers wouldn’t know where your website lives.
A slow DNS provider can add hundreds of milliseconds to every visit.
TCP Connection
After locating the server, the browser establishes a TCP connection.
This process requires multiple network round trips before data transfer begins.
Higher latency equals slower page loads.
TLS/SSL Handshake
If HTTPS is enabled (which it should be), an SSL/TLS handshake occurs.
This process:
- Validates certificates
- Establishes encryption
- Secures communication
Poor server configuration can increase handshake time.
Server Processing
The web server receives the request and passes it to the application layer.
Examples:
- PHP
- Node.js
- Python
- Java
- .NET
Complex business logic can significantly increase response times.
Database Queries
Most dynamic websites retrieve information from databases.
Common operations include:
- User authentication
- Product listings
- Blog content
- Search functionality
Poor database design often becomes the biggest bottleneck.
Browser Rendering
Once resources arrive, browsers:
- Parse HTML
- Process CSS
- Execute JavaScript
- Build the DOM
- Paint pixels to the screen
Large assets and render-blocking resources delay this process.
This sequence is known as the Critical Rendering Path.
Understanding it is the foundation of website performance optimization.
Common Reasons Websites Load Slowly
Website performance problems usually stem from a few recurring issues.
Large Images
Images are often the largest assets on a page.
Many websites upload photos directly from cameras or design software without optimization.
A 6 MB image displayed at 400×300 pixels wastes bandwidth and slows rendering.
Image Format Comparison
| Format | Compression | Transparency | Typical Use |
|---|---|---|---|
| PNG | Low | Yes | Graphics, logos |
| JPEG | Medium | No | Photographs |
| WebP | High | Yes | Modern web images |
| AVIF | Very High | Yes | Maximum compression |
Example File Sizes
| Format | Approximate Size |
|---|---|
| PNG | 2.8 MB |
| JPEG | 900 KB |
| WebP | 420 KB |
| AVIF | 250 KB |
Switching from PNG to AVIF can reduce image size by more than 90%.
Excessive JavaScript
Modern applications often rely heavily on JavaScript.
Problems include:
- Massive frameworks
- Unused libraries
- Render-blocking scripts
- Hydration overhead
Many websites ship megabytes of JavaScript users never need.
Too Many HTTP Requests
Every resource requires a request.
Examples:
- CSS files
- JavaScript bundles
- Fonts
- Analytics tools
- Chat widgets
- Social embeds
A page making 200 requests will typically load slower than one making 50.
Poor Hosting
Infrastructure matters.
Common hosting issues include:
- Shared hosting overcrowding
- Slow processors
- Limited RAM
- Slow disk storage
A poorly configured server can sabotage even a well-optimized application.
Lack of Optimization
Many websites miss basic performance practices:
- No caching
- No compression
- No minification
- No CDN
These omissions significantly increase load times.
Frontend Optimization Techniques
Frontend optimization focuses on reducing the amount of data browsers download and process.
Image Optimization
Image optimization provides some of the highest performance gains.
Example
<img
src="image.webp"
loading="lazy"
width="800"
height="600"
alt="Optimized image">
Attribute Breakdown
src
Image source.
loading=”lazy”
Delays loading until needed.
width and height
Prevent layout shifts.
alt
Improves accessibility and SEO.
Responsive Images
Different devices need different image sizes.
<img
srcset="
small.webp 480w,
medium.webp 768w,
large.webp 1200w"
sizes="(max-width:768px) 100vw, 1200px"
src="large.webp"
alt="Responsive image">
Benefits:
- Reduced bandwidth
- Faster mobile performance
- Better Core Web Vitals
CSS Optimization
Optimize stylesheets through:
- Minification
- Bundling
- Removing unused CSS
Before
body {
    margin: 0px;
    padding: 0px;
}
After
body{margin:0;padding:0}
Small improvements scale significantly across large applications.
JavaScript Optimization
Key techniques:
Tree Shaking
Removes unused code.
Code Splitting
Loads only necessary code.
Dead Code Elimination
Removes unreachable code paths.
Bundling
Combines multiple files into optimized packages.
Reduce Render-Blocking Resources
Use:
<script src="app.js" defer></script>
Async
Downloads and executes immediately.
Defer
Downloads immediately but executes after HTML parsing.
Preload
Prioritizes critical assets.
Prefetch
Downloads likely future resources.
Font Optimization
Fonts can add substantial overhead.
Strategies:
- Font subsetting
- Variable fonts
- Font preloading
- System font stacks
Example:
font-family:
system-ui,
sans-serif;
System fonts often eliminate unnecessary downloads.
[IMAGE PLACEHOLDER]
Generate a comparison infographic showing an unoptimized webpage versus an optimized webpage with lazy-loaded images, minified assets, and optimized fonts.
Backend Bottlenecks That Slow Websites
Backend performance directly affects Time To First Byte (TTFB).
Slow Application Logic
Common problems include:
Nested Loops
for(users){
  for(orders){
    // expensive work
  }
}
Complexity increases dramatically with scale.
Blocking Operations
Examples:
- File processing
- Synchronous API calls
- Long computations
Blocking operations delay responses.
Poor Server Configuration
Servers frequently suffer from:
- CPU exhaustion
- Memory shortages
- Disk bottlenecks
Monitoring resource usage helps identify these issues.
API Latency
Third-party services often become hidden bottlenecks.
Examples:
- Payment gateways
- Mapping services
- Authentication providers
Each dependency increases response time risk.
Dynamic Rendering Overhead
Dynamic rendering can be expensive.
Examples include:
- CMS processing
- Server-side rendering
- Template generation
Complex pages may require dozens of database queries before rendering.
Case Study
Before
Response Time: 4.5 seconds
Problems:
- Slow queries
- Multiple API calls
- No caching
After
Response Time: 450 milliseconds
Improvements:
- Query optimization
- Redis caching
- API consolidation
Result:
90% reduction in response time.
Database Optimization
Databases frequently become the largest performance bottleneck.
Inefficient Queries
Consider:
SELECT *
FROM users
WHERE email='john@example.com';
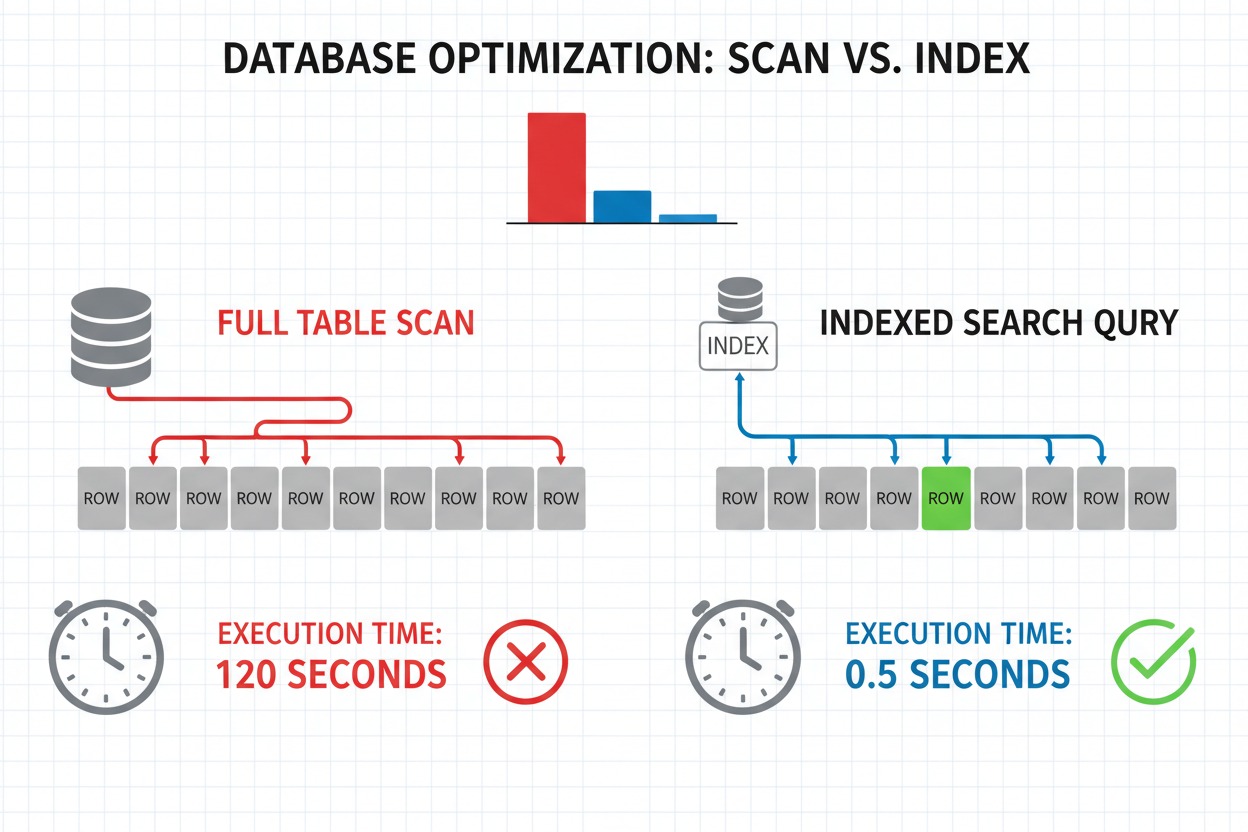
Without an index, the database may scan millions of rows.
This is called a Full Table Scan.
Understanding Indexes
Indexes function similarly to book indexes.
Instead of reading every page, the database jumps directly to the required location.
Without Index
Rows scanned:
1,000,000
Execution time:
800 ms
With Index
Rows scanned:
1
Execution time:
2 ms
The difference is dramatic.
N+1 Query Problem
Example:
Get users
Loop users
Get orders
100 users may generate 101 queries.
Better approach:
JOIN
Retrieve all necessary data at once.
Query Optimization Techniques
Select Required Columns
Bad:
SELECT *
Better:
SELECT id,name,email
Use Pagination
LIMIT 20 OFFSET 0
Add Composite Indexes
Useful for:
WHERE status='active'
AND country='US'
Database Scaling
As traffic grows:
Read Replicas
Distribute read traffic.
Replication
Maintain synchronized copies.
Partitioning
Split large tables logically.
Sharding
Distribute data across servers.
These techniques allow databases to scale efficiently.
Caching Strategies
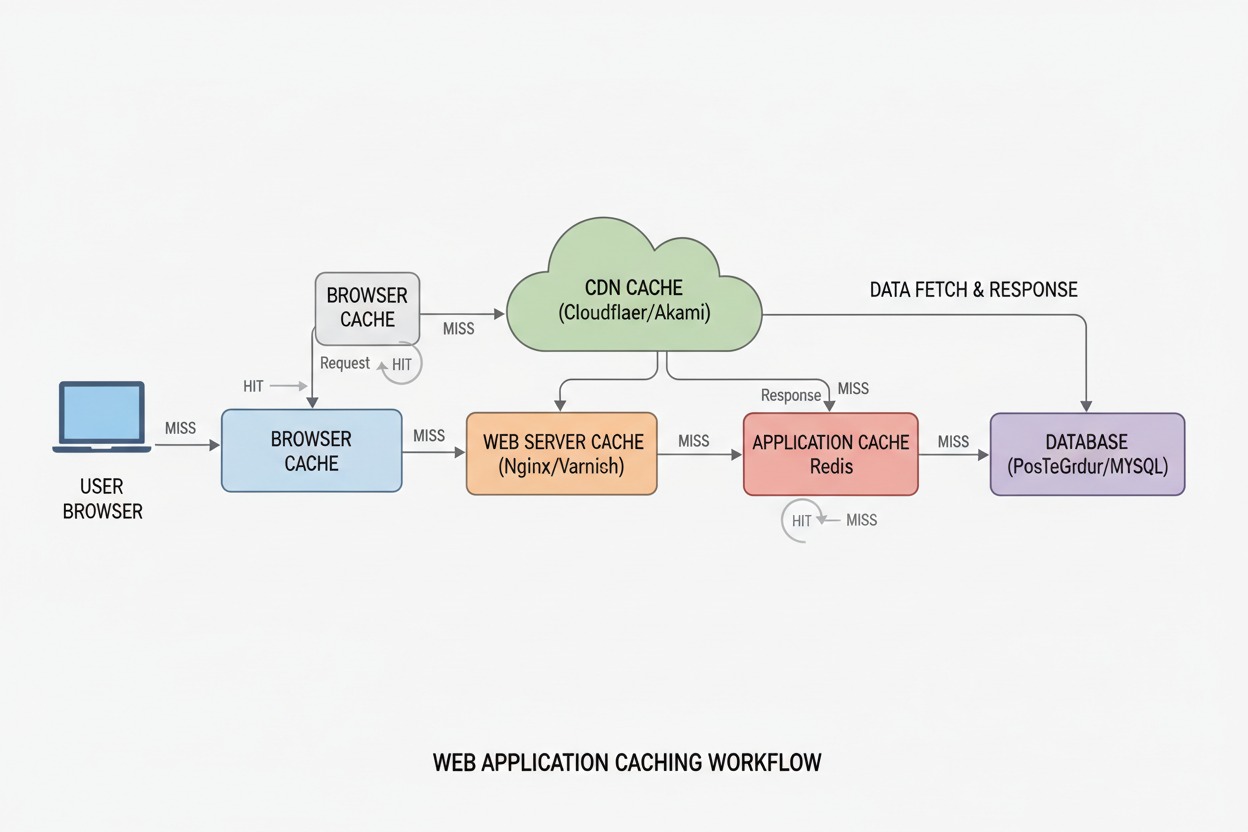
Caching often provides the highest return on investment.
Browser Caching
Example:
Cache-Control: public,max-age=31536000
Benefits:
- Fewer downloads
- Faster repeat visits
- Reduced bandwidth costs
ETags
Allow browsers to validate cached resources.
Server-Side Caching
Popular approaches include:
Full Page Caching
Stores entire rendered pages.
Fragment Caching
Caches specific sections.
Object Caching
Caches application objects.
Redis Caching
Redis stores data in memory.
Common uses:
- Sessions
- Query results
- Authentication tokens
Response times often drop from milliseconds to microseconds.
Query Caching
Benefits:
- Reduced database load
- Faster responses
Risks:
- Stale data
- Invalid cache states
Cache Invalidation
One of the hardest problems in software engineering.
Strategies include:
- Time-based expiration
- Event-driven invalidation
- Versioned caches
Proper invalidation ensures accuracy and performance.
Using a CDN Effectively
What Is a CDN?
A Content Delivery Network distributes content across global servers.
Instead of downloading files from a distant origin server, users receive content from nearby edge locations.
How CDNs Work
Request flow:
- User requests asset
- CDN checks cache
- Cache hit returns asset immediately
- Cache miss fetches origin content
This reduces latency significantly.
Benefits of CDNs
Reduced Latency
Assets travel shorter distances.
Faster Global Delivery
Users worldwide enjoy improved performance.
Lower Origin Load
Requests are offloaded to edge servers.
Better Scalability
Traffic spikes become easier to handle.
CDN Comparison
| CDN | Pricing | Ease of Use | Performance | Best Use Case |
|---|---|---|---|---|
| Cloudflare | Flexible | Excellent | Excellent | Most websites |
| AWS CloudFront | Usage-based | Moderate | Excellent | AWS environments |
| Bunny CDN | Affordable | Easy | Very Good | Small businesses |
| Fastly | Premium | Advanced | Excellent | Enterprise |
Real Example
Without CDN
Load Time: 3.8 seconds
With CDN
Load Time: 1.2 seconds
Improvement:
68% faster delivery.

Measuring Website Performance
Optimization requires measurement.
Google PageSpeed Insights
Key metrics include:
Largest Contentful Paint (LCP)
Measures loading speed.
Target:
Less than 2.5 seconds.
Cumulative Layout Shift (CLS)
Measures visual stability.
Target:
Below 0.1.
Interaction to Next Paint (INP)
Measures responsiveness.
Target:
Below 200 milliseconds.
Lighthouse
Provides audits covering:
- Performance
- Accessibility
- SEO
- Best Practices
GTmetrix
Useful for:
- Waterfall analysis
- Request breakdowns
- Asset optimization
Chrome DevTools
Developers can inspect:
- Network activity
- Rendering performance
- JavaScript execution
- Memory usage
Monitoring Platforms
| Tool | Strength |
|---|---|
| New Relic | Full observability |
| Datadog | Infrastructure monitoring |
| Pingdom | Uptime and speed monitoring |
Continuous monitoring prevents regressions.
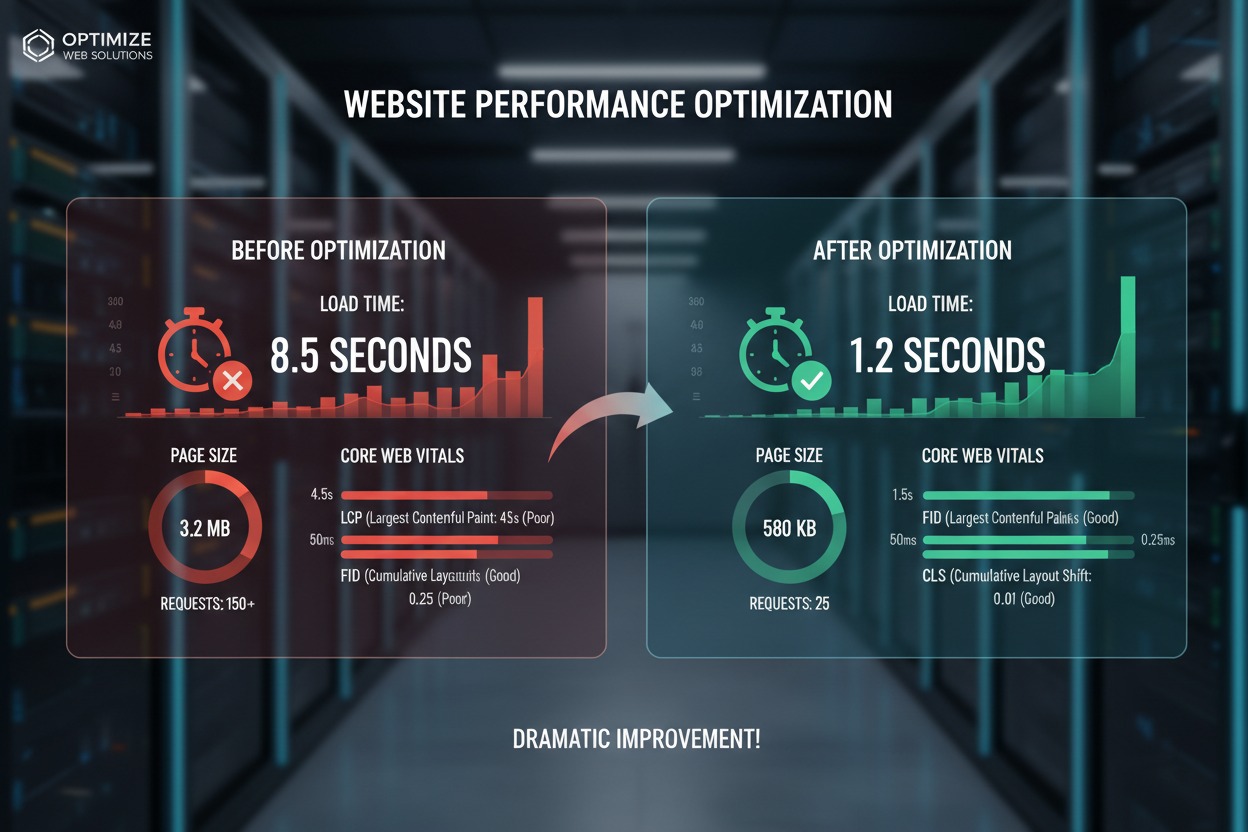
Before-and-After Performance Case Study
Before Optimization
| Metric | Value |
|---|---|
| Page Size | 8.5 MB |
| Requests | 180 |
| Load Time | 7.2 sec |
| LCP | 5.8 sec |
| CLS | 0.35 |
| TTFB | 1.8 sec |
Problems Found
- Huge images
- No CDN
- Missing caching
- Slow SQL queries
- Large JavaScript bundles
Optimizations Applied
Frontend
- Converted images to AVIF
- Enabled lazy loading
- Removed unused CSS
Backend
- Optimized APIs
- Added Redis caching
- Reduced rendering overhead
Database
- Added indexes
- Fixed N+1 queries
- Optimized joins
Infrastructure
- Added CDN
- Enabled Brotli
- Migrated to faster hosting
After Optimization
| Metric | Value |
|---|---|
| Page Size | 1.9 MB |
| Requests | 62 |
| Load Time | 1.4 sec |
| LCP | 1.6 sec |
| CLS | 0.03 |
| TTFB | 220 ms |
Business Impact
Page Size Reduction
77.6%
Request Reduction
65.5%
Load Time Reduction
80.6%
TTFB Reduction
87.8%
Results included:
- Improved rankings
- Better conversion rates
- Lower infrastructure costs
- Higher customer satisfaction
Website Performance Optimization Checklist
Frontend
- Compress images
- Use WebP or AVIF
- Lazy load media
- Minify CSS
- Minify JavaScript
- Remove unused code
- Optimize fonts
- Reduce third-party scripts
Backend
- Optimize application logic
- Enable caching
- Monitor APIs
- Upgrade infrastructure
- Reduce rendering overhead
Database
- Add indexes
- Optimize queries
- Prevent N+1 issues
- Use pagination
- Monitor slow queries
Infrastructure
- Use a CDN
- Enable Brotli
- Enable HTTP/2
- Enable HTTP/3
- Configure caching headers
Expert Tips: 10 Advanced Optimization Techniques
1. Code Splitting
Load only required JavaScript.
2. Edge Computing
Execute logic closer to users.
3. Server-Side Rendering
Improve initial page delivery.
4. Static Site Generation
Pre-render pages whenever possible.
5. Resource Prefetching
Fetch future assets proactively.
6. Brotli Compression
Often outperforms Gzip.
7. Database Replication
Scale reads efficiently.
8. Connection Pooling
Reduce connection overhead.
9. Asset Fingerprinting
Improve cache management.
10. Performance Budgets
Define limits for:
- Bundle size
- Requests
- LCP
- TTFB
This prevents regressions as applications grow.
Conclusion
Website speed has become one of the most important competitive advantages on the modern web.
Slow websites frustrate users, reduce conversions, hurt search rankings, increase infrastructure costs, and negatively impact revenue. Fortunately, most performance problems can be solved through a systematic website performance audit and the application of proven optimization techniques.
The highest-impact improvements usually come from image optimization, efficient caching strategies, database performance tuning, frontend optimization, backend optimization, CDN deployment, and continuous monitoring.
If you’re looking for quick wins, start by compressing images, enabling caching, reducing JavaScript payloads, optimizing database queries, and deploying a CDN. These changes alone can dramatically reduce page load times.
Performance optimization is not a one-time project. It is an ongoing process that requires measurement, monitoring, testing, and refinement as your application evolves.
Run a performance audit today, identify your biggest bottlenecks, and begin implementing improvements. Every second you remove from your load time creates a faster user experience, stronger SEO performance, better conversions, and a more successful website.